Blog
Tips, tutorials and guides for CodePic

How Claude Works — A Visual Guide from Prompt to Response
A visual walkthrough of Claude's full lifecycle — input assembly, reasoning pipeline, response, agentic loop with MCP, and the training background that shaped the model.

How to Make a Mind Map Online — a Step-by-Step Guide
A practical walkthrough for turning a fuzzy idea into a two-sided mind map in the browser: pick a center, branch outward, keep both sides balanced, and export when you're done.

How to Make a Line Chart (Step-by-Step Guide)
A practical guide to making a clear line chart — how to choose your data, scale the axis honestly, label points, and avoid the mistakes that mislead readers.

GPT-image 2 vs Nano Banana 2 (2026): A Visual Side-by-Side
GPT-image 2 vs Nano Banana 2 — pricing, capability scores, feature matrix and a price-vs-quality quadrant, all in one visual comparison. Fork the template and swap in any models you want to compare.

How to Make a Flowchart (Step-by-Step Tutorial)
A practical guide to making flowcharts — from identifying your process to drawing a clear, useful diagram. Includes a real-world example, common mistakes, and tool recommendations.

The Best Free Kanban Board Tools in 2026
A hands-on comparison of free kanban board tools — what each one actually gives you for free, where the limits are, and which one fits the way you work.

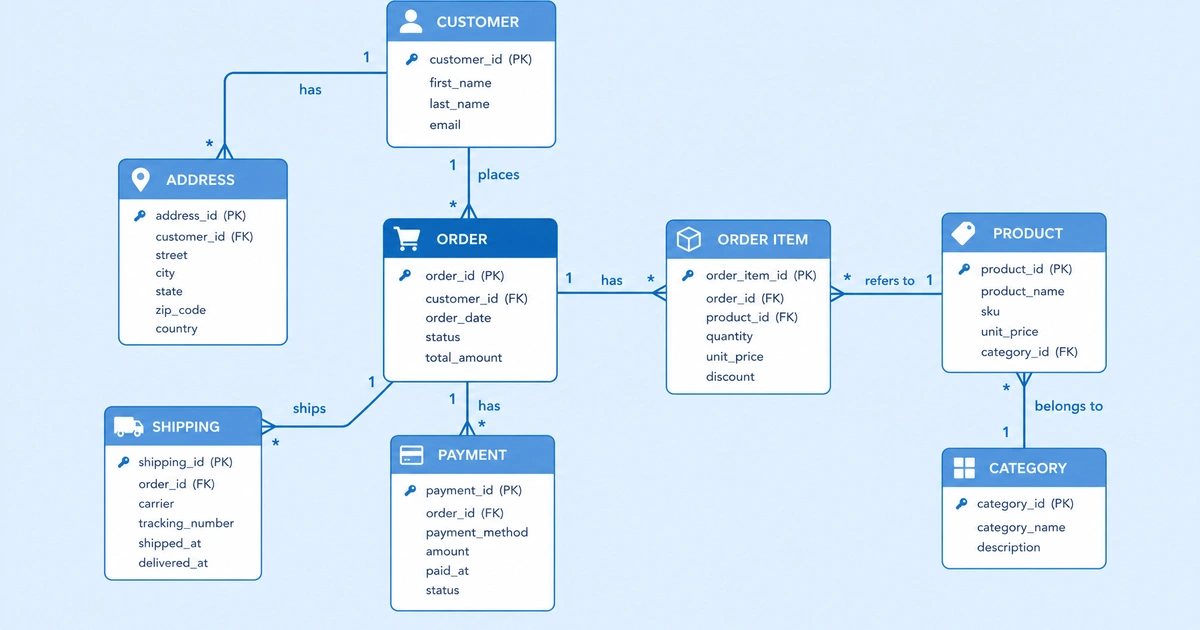
How to Draw an ER Diagram: Step-by-Step Guide (2026)
Learn how to draw an ER diagram (ERD) in 5 steps — identify entities, define attributes, map relationships, apply cardinality (1:1, 1:N, M:N), and avoid common mistakes. Includes a free online ER diagram maker and worked example.

Free SWOT Analysis Template: 7 Editable Designs (2026)
Free SWOT analysis template you can edit in the browser — plus 6 more from Canva, Miro, Lucidchart, Creately, Google Slides and FigJam compared. Real free-tier limits, download formats (PDF/PNG), and which template fits your strategy review.

What Is a Flowchart? Definition, Symbols, Types, and Examples
A complete guide to flowcharts — what they are, what the shapes mean, the different types, real-world examples across industries, and when to use one.

Flowchart Symbols: Meaning, Definition & Examples
Complete guide to flowchart symbols and their meanings — every common shape defined with examples, plus the 4 basic symbols most flowcharts actually need. Includes process, decision, terminator, parallelogram and connector symbols.

Types of Flowcharts: 8 Common Formats and When to Use Each
A guide to the main types of flowcharts — process, swimlane, workflow, data flow, and more — with real examples and advice on which one fits your task.

The Best Free Flowchart Makers in 2026
A practical comparison of free flowchart tools — what each one offers, what the real limits are, and how to pick the right one for your team and workflow.

Getting Started with Flowcharts: A Complete Beginner's Guide
Everything you need to know to create your first flowchart — what the shapes mean, how to structure a process, common mistakes to avoid, and practical examples.

How to Make an Approval Process Flowchart (with Template)
Learn how to map an approval workflow — request intake, manager review, rejection loops, and final sign-off — with a step-by-step guide and an editable approval flowchart template.

How to Make an Onboarding Flowchart (Customer & Employee)
Map your onboarding process from day one to first success — account setup, kickoff, training, and support paths — with a step-by-step guide and an editable onboarding flowchart template.

How to Make a Troubleshooting Flowchart (with Template)
Turn incident response and debugging into a repeatable decision path — status checks, log review, rollback, and recovery verification — with a step-by-step guide and an editable troubleshooting flowchart template.

Customer Service Flowchart: Examples and How to Build One
A step-by-step customer service flowchart — from first contact to ticket resolution — with the full process mapped out, common branches, mistakes to avoid, and an editable template to start from.

Hiring Process Flowchart: Examples and How to Build One
A step-by-step hiring process flowchart — from job requisition to onboarding — with the full recruitment process mapped out, common branches, mistakes to avoid, and an editable template to start from.

Order Processing Flowchart: Examples and How to Build One
A step-by-step order processing flowchart — from checkout to delivery — with the full fulfillment process mapped out, common branches, mistakes to avoid, and an editable template to start from.

Return & Refund Process Flowchart: Steps, Template, and Examples
A step-by-step return and refund process flowchart — from a customer's return request to the final refund or exchange — with every decision branch, common variations, mistakes to avoid, and an editable template to start from.

Incident Management Flowchart: ITIL Process and Template
A step-by-step incident management flowchart — from detection and severity triage through response, communication, resolution, and postmortem — mapped to the ITIL incident process, with common variations, mistakes, and an editable template.

Kanban vs Gantt Chart: Which Should You Use?
A practical comparison of Kanban boards and Gantt charts — how they work, what each one is best at, and how to decide which fits your project and team.

What Is a Kanban Board? A Complete Guide with Examples
What a Kanban board is, how columns, cards, and WIP limits work, real examples across different teams, and when Kanban is the right tool for your workflow.

How to Make a Kanban Board: A Step-by-Step Guide
How to make a kanban board from scratch — define your columns, break work into cards, set WIP limits, and pull work through. A practical step-by-step tutorial with tips, common mistakes, and an editable template to start from.

What Is a Gantt Chart? A Complete Guide with Examples
What a Gantt chart is, how to read one, the key components, real examples across project types, and when a Gantt chart is — and isn't — the right planning tool.

How to Make a Gantt Chart (Step-by-Step Guide)
A practical guide to creating a Gantt chart from scratch — what to include, how to structure tasks and timelines, and common mistakes to avoid.

The Best Free Gantt Chart Makers in 2026
A practical guide to free Gantt chart tools — what each one offers, the actual limits, and which one fits your project management workflow.

What Is a Mind Map? A Clear Explanation with Examples
What a mind map is, how it works, when to use one, and how it differs from outlines, flowcharts, and other visual thinking tools.

How to Make a Mind Map: A Step-by-Step Guide
A practical, step-by-step guide to making a mind map — from picking a central topic to adding branches, child nodes, and color — plus tips, common mistakes, and an editable template to start from.

The Best Free Mind Map Makers in 2026
A practical comparison of free mind mapping tools — what each one offers, the real limits, and which one fits how you actually work.

Mind Maps: A Better Way to Brainstorm and Organize Ideas
Mind maps are one of the most effective tools for brainstorming and organizing complex information. Learn the core concepts, best use cases, and how to create one quickly in CodePic.
What Is an ER Diagram? A Complete Guide to Entity-Relationship Diagrams
What an ER diagram is, what entities, attributes, and relationships mean, how to read cardinality notation, real examples, and when to use one in database design.
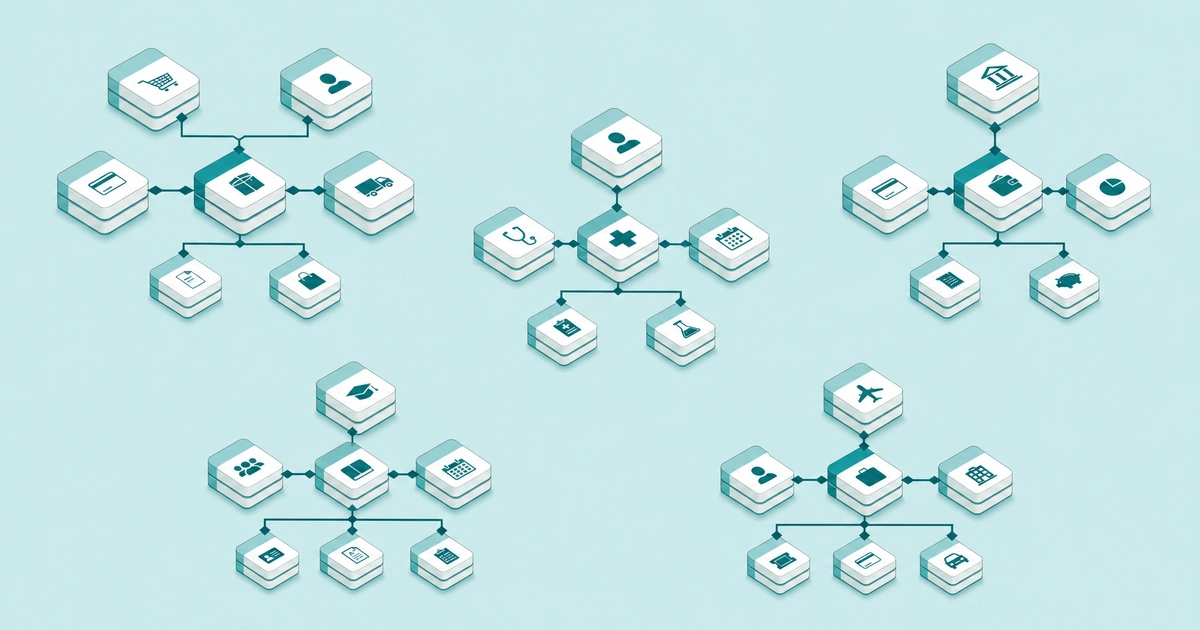
ER Diagram Examples: 5 Real-World Database Designs Explained
Five practical ER diagram examples with full entity, attribute, and relationship breakdowns — covering e-commerce, school, hospital, library, and social media databases. Downloadable ERD templates included.

What Is a Sequence Diagram? A Complete Guide with Examples
What a sequence diagram is, how to read the notation, what the elements mean, real examples across different systems, and when sequence diagrams are the right tool.
Sequence Diagrams: How to Visualize Flows, APIs, and User Journeys
Sequence diagrams show who does what and in what order — making them the clearest way to document API calls, user flows, and service interactions. Learn the core ideas and how to build one in CodePic.

UML Diagram Types: A Practical Guide to All 14 Diagrams
A clear guide to all 14 UML diagram types — what each one shows, when to use it, and which ones are actually useful in day-to-day software development.

Excalidraw vs draw.io: Which Free Diagramming Tool Fits Your Workflow?
A detailed comparison of Excalidraw and draw.io — two free, open-source diagramming tools with very different design philosophies. We compare visual style, features, collaboration, integrations, and more.

Excalidraw vs Miro: Infinite Canvas Tools for Very Different Jobs
A hands-on comparison of Excalidraw and Miro — two whiteboard-style tools with different strengths. We compare pricing, real-time collaboration, diagram features, integrations, and which one fits your workflow.

Excalidraw vs tldraw: Which Hand-Drawn Whiteboard Should You Use?
A detailed comparison of Excalidraw and tldraw — two leading hand-drawn-style whiteboards with similar canvas feel but very different licensing, AI integration, and developer stories.

Miro vs draw.io: Collaboration Platform or Diagramming Tool?
A practical comparison of Miro and draw.io — one a visual collaboration platform, the other a free diagramming powerhouse. We compare pricing, diagram depth, collaboration, integrations, and data ownership.

Miro vs Lucidchart: Which Visual Collaboration Tool Is Right for You in 2026?
A detailed comparison of Miro and Lucidchart across pricing, features, collaboration, diagram depth, integrations, and ease of use — so you can pick the right tool for your team.

draw.io vs Lucidchart (2026): Pricing, Features & Which to Pick
draw.io vs Lucidchart in 2026 — full comparison of pricing, features, collaboration, and AWS/GCP/Azure support. Includes feature and pricing tables, how to migrate/convert between them, which to pick by diagram type (ERD, UML, cloud), and a detailed FAQ.

Mermaid vs draw.io (2026): Diagram-as-Code or Visual Editor?
Mermaid vs draw.io — a practical comparison of the two most popular free diagram tools. Text-based diagrams-as-code versus a visual drag-and-drop editor, with a feature table, when to use each, and an FAQ.

Mermaid vs Lucidchart (2026): Free Code or Paid Visual Tool?
Mermaid vs Lucidchart — free diagram-as-code versus a paid visual platform. Compare syntax vs drag-and-drop, pricing, collaboration, and version control, with a feature table and when to use each.

Excalidraw Alternatives: The Best Hand-Drawn Whiteboard Tools in 2026
Looking for an Excalidraw alternative? Here are the best hand-drawn and online whiteboard tools in 2026 — compared on features, collaboration, AI support, and who each one is for.

tldraw Alternatives in 2026: Hand-Drawn Whiteboards Compared
A practical comparison of tldraw alternatives — hand-drawn-style whiteboards, diagramming tools, and collaborative canvases — with what each one actually does well and where it falls short.

6 Best draw.io Alternatives for Diagrams and Flowcharts in 2026
draw.io is free and powerful, but it's not the only option. Here are 6 alternatives compared on collaboration, UI design, diagram types, and pricing — with honest trade-offs for each.

6 Miro Alternatives Worth Trying in 2026
Miro is a capable whiteboard tool, but it's not the right fit for everyone. Here are six alternatives — covering price, features, and use cases — so you can find the one that actually fits your workflow.

6 Lucidchart Alternatives Worth Considering in 2026
Lucidchart is solid, but the free tier is tight and paid plans add up fast. Here are six alternatives that cover the same ground — some cheaper, some more specialized, some free entirely.

6 Visio Alternatives That Work Online in 2026
Microsoft Visio is powerful but expensive, Windows-dependent, and not built for modern team workflows. Here are six alternatives — including free options — that get the job done in a browser.

6 Whimsical Alternatives for Flowcharts, Wireframes, and Mind Maps in 2026
Whimsical is elegant but limited on free plans and diagram types. Here are 6 practical alternatives — compared on features, collaboration, pricing, and who each one is best for.

Best Diagramming Tools in 2026: A Practical Comparison
A side-by-side comparison of the most widely used diagramming tools — Miro, Lucidchart, draw.io, Visio, Excalidraw, and more — across pricing, collaboration, AI features, and use cases.

The Best Free Online Whiteboard Tools in 2026
A practical guide to free online whiteboard tools — what each one is good at, where it falls short, and how to pick the right one for your team.

What Is an Infinite Whiteboard? A Clear Explanation with Examples
What an infinite whiteboard is, how an endless canvas changes the way you think visually, when to use one, and how it differs from slides, documents, and traditional diagramming tools.

6 Best Free Wireframe Tools in 2026 (Tested & Compared)
Hands-on review of 6 free wireframing tools — Figma, Balsamiq, Penpot, Marvel, Wireframe.cc and CodePic. Real free-tier limits, fidelity range, collaboration support, and which tool fits your design workflow in 2026.

The Best Free Org Chart Makers in 2026
A practical guide to free org chart tools — what each one offers, the real limits, and which one fits your needs for team visualization.

7 Best Free Timeline Makers in 2026 (Side-by-Side Compared)
Compared 7 free timeline makers side-by-side — Canva, Miro, CodePic, Preceden, TimeGraphics and more. See real free-tier limits, watermarks, export formats, and a ready-to-edit free timeline template with no signup.

7 Free Decision Tree Makers Compared (2026)
A hands-on comparison of free decision tree tools — what each one actually offers for branching logic, node customization, layout, and collaboration.

The Best Free Product Roadmap Templates & Tools in 2026
A hands-on comparison of free product roadmap tools — what each one actually offers, where the limits are, and which fits your planning workflow.

What Is a Wireframe? A Complete Guide for Designers and Product Teams
What a wireframe is, what it contains, how it differs from mockups and prototypes, real examples, and when to use wireframes in the design process.
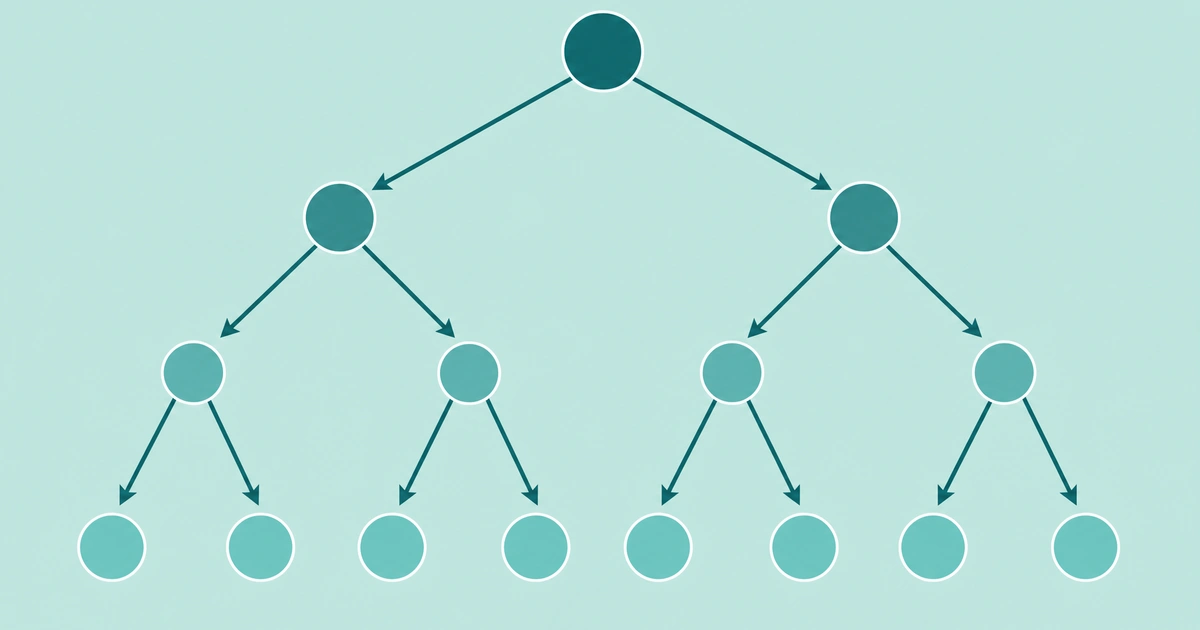
What Is a Decision Tree? Definition, Examples, and How It Works
A practical guide to decision trees: what they are, how they work, key parts, common types, real-world examples, and how to create one.

What Is a SWOT Analysis? Definition, Examples, and How to Use It
A practical guide to SWOT analysis: what strengths, weaknesses, opportunities, and threats mean, real examples, common mistakes, and how to turn a SWOT into action.

How to Do a SWOT Analysis: A Step-by-Step Guide
A practical, step-by-step guide to doing a SWOT analysis — how to fill Strengths, Weaknesses, Opportunities, and Threats, turn the four quadrants into action, plus tips, common mistakes, and an editable template.

What Is a Venn Diagram? Definition, Examples, and When to Use One
A practical guide to Venn diagrams: what they are, how sets and overlaps work, real-world examples, common mistakes, and how they compare with matrices, mind maps, SWOT, and feature comparison tables.
What Is a Fishbone Diagram? Root Cause Analysis Guide with Examples
Learn what a fishbone diagram is, how it helps teams find root causes, common cause categories, practical examples, and how to create one step by step.

What Is a Product Roadmap? Definition, Examples, and Best Practices
A practical guide to product roadmaps: what they are, what they should show, common roadmap types, real examples, mistakes to avoid, and how roadmaps compare with Gantt charts, Kanban boards, backlogs, and strategy documents.

What Is a User Persona? Definition, Examples, and How to Create One
A practical guide to user personas: what they are, what they include, real-world examples, common mistakes, and how to use personas in product decisions.

What Is a Business Model Canvas? The 9 Building Blocks Explained
A practical guide to the business model canvas: what it is, how the 9 building blocks fit together, examples, common mistakes, and when to use it instead of other planning tools.

What Is an OKR? Objectives and Key Results Explained with Examples
A practical guide to OKRs: what Objectives and Key Results mean, how to write good OKRs, real examples for product, marketing, engineering, and personal growth, plus common mistakes to avoid.

Agile vs Waterfall: Key Differences and When to Use Each
A clear comparison of agile and waterfall project management — how they differ in planning, flexibility, team structure, and risk — with practical guidance on which to choose.

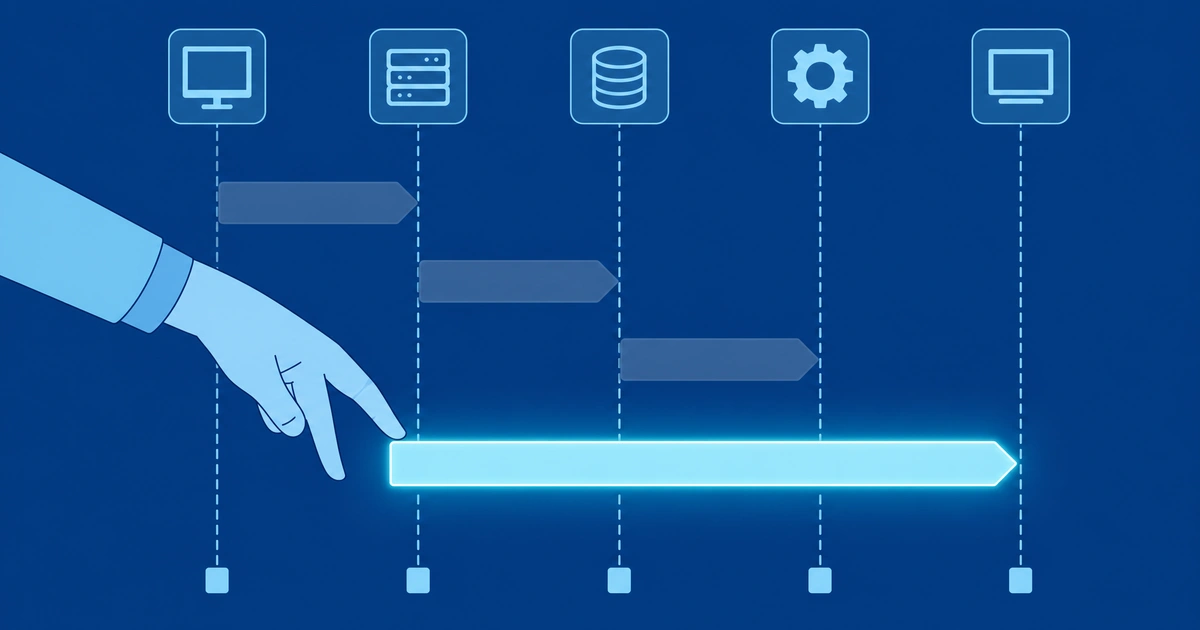
How to Draw a System Design Diagram (With Real Examples)
A practical guide to drawing system design diagrams — the essential components, how to structure them, and walkthrough examples of real architectures like URL shorteners, chat systems, and news feeds.

Getting the Most Out of CodePic MCP: A Practical Guide
Master CodePic MCP with this in-depth guide covering prompting techniques, tool usage, and real-world scenarios for creating diagrams with AI.

CodePic MCP Server Is Live: Let AI Draw Your Diagrams
CodePic now supports MCP, letting you create and edit hand-drawn style diagrams directly from Cursor, Claude, and other AI tools — no copy-pasting required.

Generate Architecture Diagrams from Cursor with MCP
Learn how to connect Cursor to CodePic MCP and generate editable system architecture diagrams from natural language prompts. Includes setup, example prompts, and a Next.js SaaS architecture walkthrough.

Draw Architecture Diagrams in Chat: OpenClaw + CodePic MCP in Practice
Complete guide to integrating OpenClaw and CodePic MCP for drawing diagrams directly in Telegram and Discord chats with AI assistance.

How to Embed Code Blocks in Diagrams — Make Technical Docs Self-Explanatory
Use CodePic's Code element to embed syntax-highlighted code snippets directly inside flowcharts and architecture diagrams. 20+ languages, dark/light themes, line numbers — no more pasting code screenshots.
How to Embed Diagrams in Your Website and Docs — The Complete CodePic Embed Guide
Embed CodePic flowcharts and architecture diagrams into blogs, Notion, and doc sites with one iframe snippet. Auto-scaling, hand-drawn style preserved, and edits sync automatically — no more re-exporting screenshots.