"流程图"是个宽泛的词。最基础的那种从上到下、由方框和箭头组成的图只是其中一种,此外还有若干相关格式——每种适配不同类型的流程。选对类型能让图更易读、也更好画。
本文覆盖你最可能用到的 8 种流程图类型,说明各自的用途和适用时机。想了解这些图里出现的形状,参见流程图符号指南;想了解流程图这个格式本身,参见什么是流程图?。
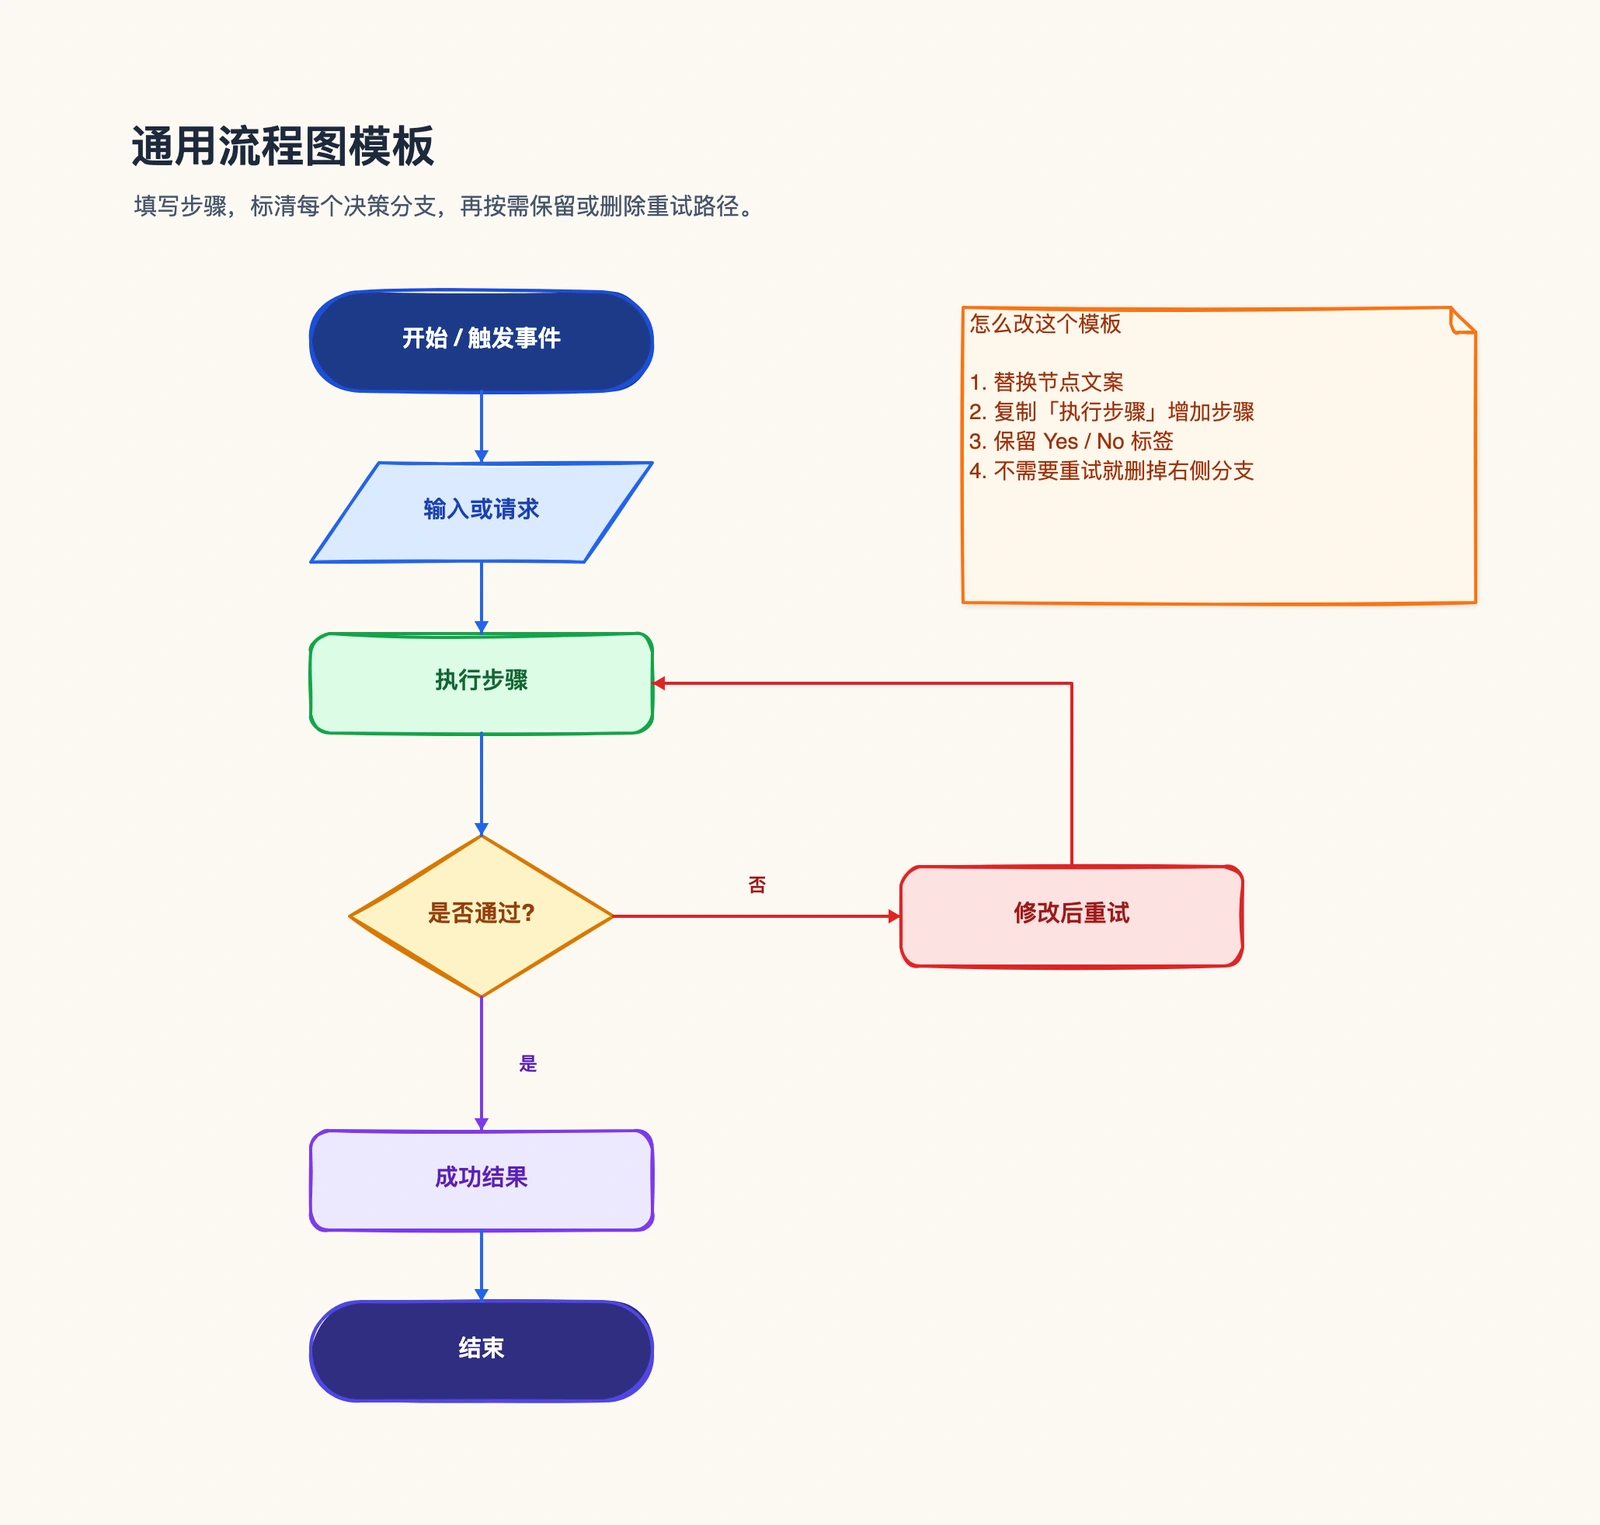
1. 基础流程图(Process Flowchart)
是什么: 默认格式。步骤从上到下或从左到右排列,在分支处用判断菱形。
何时用: 几乎任何场景——记录一项操作、解释某个功能如何运作、把一个任务从头到尾梳理清楚。如果你不确定该用哪种类型,从这里开始就对了。
多数情况下基础流程图就是正确答案。本列表里的其他类型都是它的特化版本,只有当基础流程图表达不了某些东西时才需要换用。电商的订单处理流程、内部的招聘流程、故障处理流程——这些都属于典型的基础流程图。打开流程图模板,从现成的开始画。
2. 泳道图(Swimlane Flowchart)
是什么: 把基础流程图按泳道划分——横向或纵向的带状区域,每条泳道对应一个人、团队或系统。每一步放在执行者所在的泳道里。
何时用: 当涉及多方、需要表达"谁"做每一步而不只是"做了什么"时。泳道图让交接变得可见:每当箭头跨越泳道边界,责任就转手了——而这恰恰是流程最容易出问题的地方。
审批流程是典型例子:一个申请从申请人,到经理,再到财务,各在自己的泳道里——参见审批流程图。退款流程也常做成泳道图,因为客服、仓库、财务各自的动作要分开展示。可参考泳道图模板或审批流程图模板。
3. 工作流图(Workflow Diagram)
是什么: 一种更宽松、规范化程度较低的流程图,关注业务流程的步骤和归属,而非技术上的精确性。
何时用: 业务流程文档,受众偏非技术,目标是讲清楚谁、按什么顺序、做什么。工作流图用可读性换取了正式流程图那套严格的符号规则。
工作流图和基础流程图的界线很模糊——实践中,"工作流"暗示业务受众,"流程图"暗示更偏技术的受众。员工入职流程图就是典型的工作流。
4. 数据流图(DFD)
是什么: 关注数据如何在系统中流动的图——数据从哪来、被哪些处理过程转换、存到哪去。它用一套独特的符号(处理过程、数据存储、外部实体、数据流),而非标准流程图符号。
何时用: 软件与系统分析,当问题是"这份数据从哪来、到哪去"而非"步骤是什么"时。数据流图回答的是关于信息的问题,而非控制流。
如果你在梳理信息如何在各组件之间流动,从数据流模板开始。
5. 决策树(Decision Tree)
是什么: 几乎每个节点都是分支判断的流程图。它从单个起始问题出发,扇形展开成一棵结果树。
何时用: 诊断和分类任务——故障排查指南、资格检查、"我该选哪个?"这类流程。当整个流程就是一连串分支问题时,决策树比塞满菱形的普通流程图更清晰。
客服故障排查流程图本质上就是一棵决策树:每个症状引出一个问题,每个回答引出下一步。真实的客服流程通常就是一棵决策树,前端问题按类型分叉到不同处理路径。
6. 跨职能流程图(Cross-Functional Flowchart)
是什么: 专门围绕组织职能(销售、研发、客服)而非具体个人来组织的泳道图。
何时用: 当你想表达工作如何跨部门流转、团队间交接在哪里时。它是发现"瓶颈藏在职能之间的缝隙里、而非任一职能内部"的合适视角。
它在功能上就是泳道图,区别只在泳道代表什么。员工入职、故障处理这类跨部门流程都很适合用它。泳道图模板两者都适用。
7. 流程地图(Process Map)
是什么: 流程的更高层视图,通常比逐步的流程图更粗略,用于在深入细节前先给出全局概览。
何时用: 流程改进和分析,当你想先一眼看清整个流程——它的主要阶段和决策点——再去逐步记录每个细节时。流程地图在运营和精益/六西格玛工作中很常见。
流程地图模板给你一个端到端概览的起始结构。
8. 系统 / API 流程图
是什么: 表达技术系统或 API 请求如何在组件(服务、队列、数据库)之间流转的流程图,而非人的步骤。
何时用: 软件架构和集成文档,当"参与者"是系统而非人时。这类图帮工程师推理请求路径、失败模式和依赖关系。
API 工作流模板正是为这类技术流程设计的。
按业务场景选类型
多数人搜「流程图类型」是因为手头有一个具体的东西要画。下面把常见的国内业务场景对上合适的类型,直接查用:
| 业务场景 | 该用的类型 | 参考文章 |
|---|---|---|
| 审批 / 报销 / 请假 | 泳道图(跨角色交接是重点) | 审批流程图 |
| 订单履约(电商发货、支付、缺货) | 基础流程图(含判断分支) | 订单处理流程 |
| 员工入职 / 离职 | 工作流图 或 跨职能流程图 | 入职流程图 |
| 招聘 / 面试 | 基础流程图 或 泳道图 | 招聘流程图 |
| 客服接单 / 故障处理 | 决策树 | 客服流程 |
| 退货 / 退款 | 泳道图(客服、仓库、财务分工) | 退款流程 |
| 生产事故 / 故障响应 | 跨职能流程图(跨团队协同) | 故障处理流程 |
| 系统架构 / 请求链路 | 系统流程图 / API 流程图 | — |
| 数据加工 / ETL | 数据流图(DFD) | — |
| 高层业务概览 | 流程地图 | — |
选不出来时,先按「谁在做」判断:只有一个执行者 → 基础流程图;多角色/多部门 → 泳道图或跨职能流程图,八成场景到这一步就能定型。
如何选择
快速判断:
- 单一直白的流程? → 基础流程图
- 多人或多团队交接? → 泳道图 / 跨职能图
- 业务受众、归属重要? → 工作流图
- 关于数据而非步骤? → 数据流图
- 每个节点都是分支选择? → 决策树
- 需要先看高层概览? → 流程地图
- 是系统和 API 而非人? → 系统 / API 流程图
拿不准时,从基础流程图开始,只有在它表达不了所需内容时才换。多数图永远不需要更复杂的类型。
常见问题
最常见的流程图类型是哪种?
最常见的是基础流程图。它用从上到下或从左到右的步骤加判断分支来表达流程,能覆盖绝大多数日常需求。
流程图和泳道图有什么区别?
泳道图是把流程图按泳道划分,每条泳道代表一个人、团队或系统。普通流程图表达"发生了什么",泳道图还额外表达"谁负责每一步"。
我该用哪种流程图?
多数任务从标准的基础流程图开始即可。涉及多人或多团队时换成泳道图,关注数据流向时用数据流图,每个节点都是分支选择时用决策树。
想动手画一个?打开流程图工具从空白画布开始,或挑一个匹配你所需类型的流程图模板——都无需注册。