ER 图(实体关系图)是数据库结构的可视化地图。它展示存在哪些数据类型(实体)、每种类型存储哪些信息(属性),以及不同数据类型之间的关联方式(关系)。关于 ER 图的概念和使用场景,可以先看 ER 图是什么。
从零设计数据库时,ER 图是你在写任何 SQL 之前梳理结构的工具。加入一个有现成数据库的项目时,ER 图是理解数据关联方式最快的途径。向不懂 SQL 的人解释数据库时,ER 图比 schema 导出要直观得多。
三个核心概念
实体
实体是你想存储数据的"事物"。在数据库里,实体对应表。当你描述一个系统时,自然出现的名词通常是实体候选:
- 用户账号系统有用户、会话、角色
- 电商平台有商品、订单、客户、分类
- 博客系统有文章、作者、评论、标签
判断一个概念是否应该成为实体的方法:它需要存储自己的一组属性吗?如果是,它可能就是实体。
属性
属性是你为每个实体存储的数据字段。用户实体可能有:id、email、username、password_hash、created_at。商品可能有:id、name、price、description、stock_quantity。
每个实体有一个特殊属性:主键。它是每条记录的唯一标识符,通常是 id 列。每个实体必须有一个主键。
关系
关系描述实体之间的连接方式。订单属于客户。文章由作者撰写。商品可以出现在多个订单中,一个订单也可以包含多个商品。
关系有两个重要属性:类型(什么样的关系)和基数(各方有多少个)。
理解基数
基数是 ER 图里最容易让人困惑的部分。它描述一个实体的多少个实例可以与另一个实体的多少个实例相关联。
一对一(1:1) 实体 A 的每个实例恰好对应实体 B 的一个实例,反之亦然。 例:一个用户有一份个人资料。一份个人资料属于一个用户。
一对多(1:N) 实体 A 的一个实例对应实体 B 的多个实例,但实体 B 的每个实例只对应一个 A。 例:一个客户可以下多个订单,但每个订单只属于一个客户。
多对多(M:N) 实体 A 的多个实例对应实体 B 的多个实例。 例:一个商品可以出现在多个订单中,一个订单可以包含多个商品。
多对多关系需要一个中间表——一个位于两个实体之间、存储关联关系的第三个实体。对于商品和订单的例子,需要新增一个订单项实体,包含 order_id、product_id 和 quantity 字段。
一步一步画 ER 图
第一步:识别实体
阅读系统描述或需求文档,划出名词。这些是你的实体候选。然后问:每个候选是否需要存储自己的数据?删掉那些本质上只是属性的概念。
以一个图书馆系统为例,你可能识别出:图书、会员、借阅记录、作者。
第二步:定义每个实体的属性
为每个实体列出需要存储的数据,并标注主键(在图中通常用下划线或 PK 标记)。
图书:id (PK)、书名、ISBN、出版年份、类型
会员:id (PK)、姓名、邮箱、入会日期
作者:id (PK)、姓名、简介
借阅记录:id (PK)、借出日期、应还日期、实还日期
第三步:识别关系
逐对检查实体,问:它们之间是什么关系?
- 图书和作者:一本书可以有多个作者,一个作者可以写多本书 → 多对多
- 会员和借阅记录:一个会员可以有多条借阅记录,但每条记录只属于一个会员 → 一对多
- 借阅记录和图书:一条借阅记录对应一本书,但一本书可以有多条历史借阅记录 → 多对一(从借阅记录角度看是多对一)
第四步:处理多对多关系
图书和作者的多对多关系需要一个中间表:
图书作者:book_id (FK)、author_id (FK)
这个表没有自己的主键——book_id 和 author_id 的组合就是主键。
第五步:添加外键
对每个一对多关系,"多"的一侧添加指向"一"的一侧的外键。
- 借阅记录增加
member_id (FK)指向会员 - 借阅记录增加
book_id (FK)指向图书
第六步:画出图表
有了实体、属性、关系和基数,就可以画图了:
- 矩形表示实体
- 椭圆表示属性(或直接在矩形内列出——现代 ER 图更常用这种方式)
- 连线表示关系,两端标注基数符号
- 菱形表示关系名称(传统风格),或直接在连线上标注
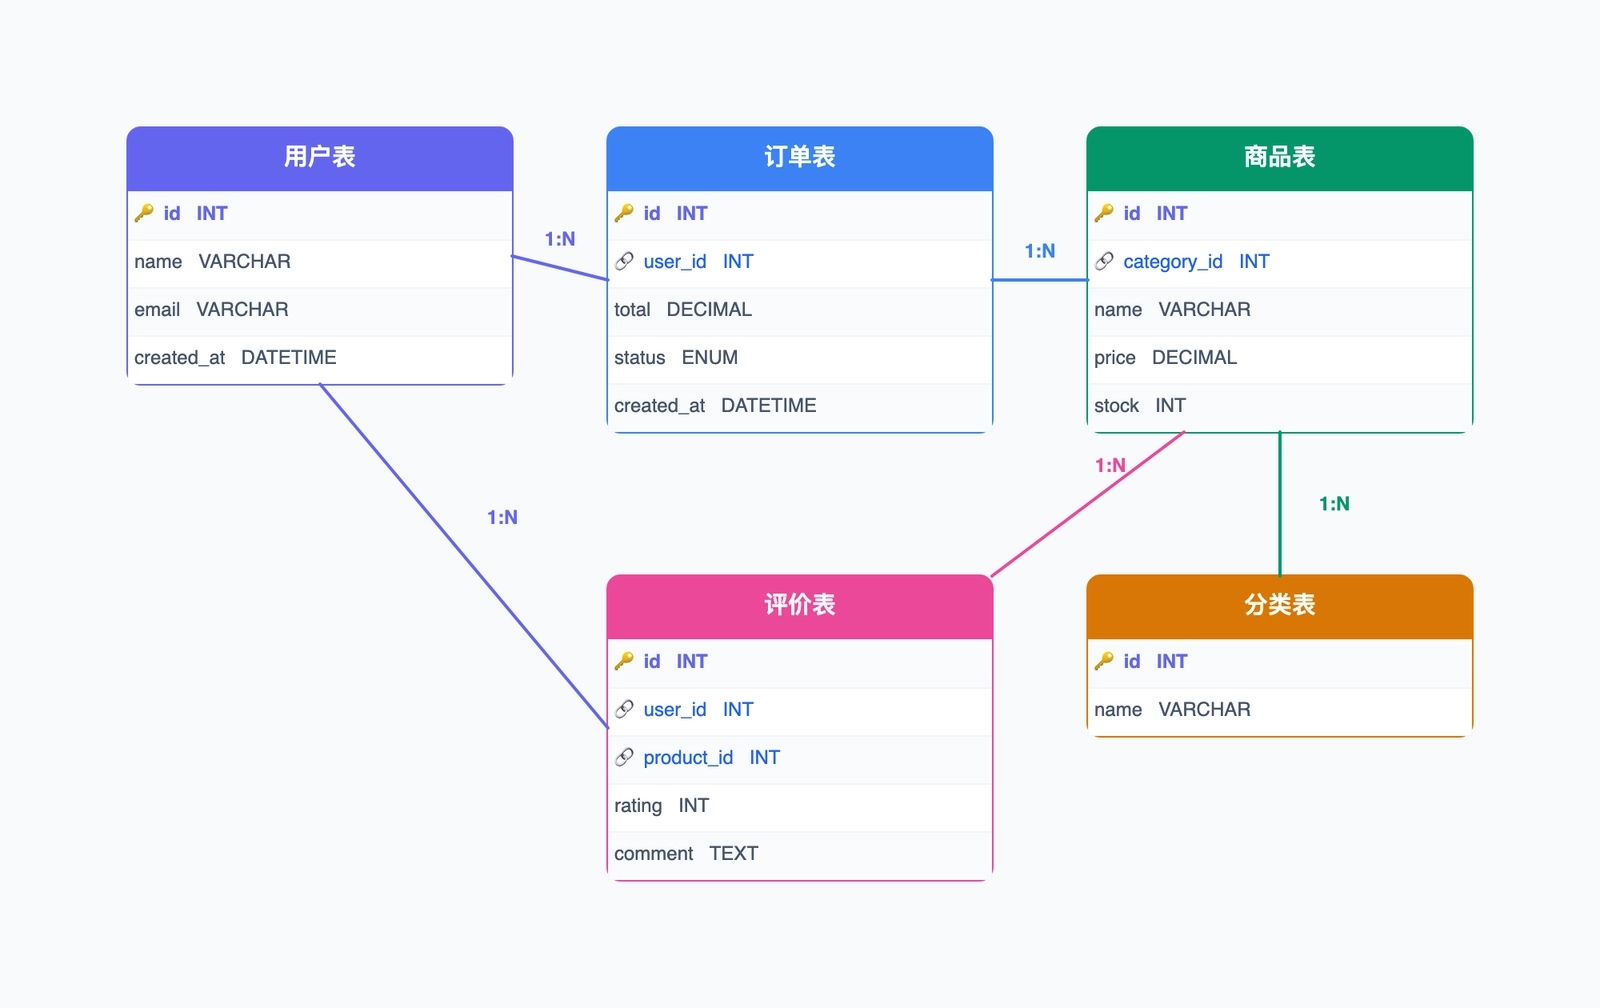
示例:电商平台 ER 图
客户 (id PK, 姓名, 邮箱, 地址)
    |
    | 1:N
    |
订单 (id PK, 下单时间, 状态, customer_id FK)
    |
    | N:M(通过 订单项)
    |
商品 (id PK, 名称, 价格, 库存, category_id FK)
    |
    | N:1
    |
分类 (id PK, 名称, parent_category_id FK)

订单项 (order_id FK, product_id FK, 数量, 下单时单价)
几个值得注意的设计决策:
下单时单价放在订单项而不是商品上——因为价格会变动,需要记录下单那一刻的价格- 分类有
parent_category_id自引用——支持嵌套分类(电子产品 → 笔记本电脑 → 游戏本) - 订单项记录
数量,因为一个订单可能包含同一商品的多件
自己画时,可以直接从 ER 图模板开始。模板把关系标签放在连接线附近,并提供可复用的实体布局,能避免图最后变成一堆彼此断开的数据库框。
鸦脚表示法 vs 陈式表示法
你会看到两种主要的 ER 图表示法:
陈式表示法(原始版本):
- 矩形 = 实体
- 椭圆 = 属性
- 菱形 = 关系名称
- 连线上标注
1、M或N
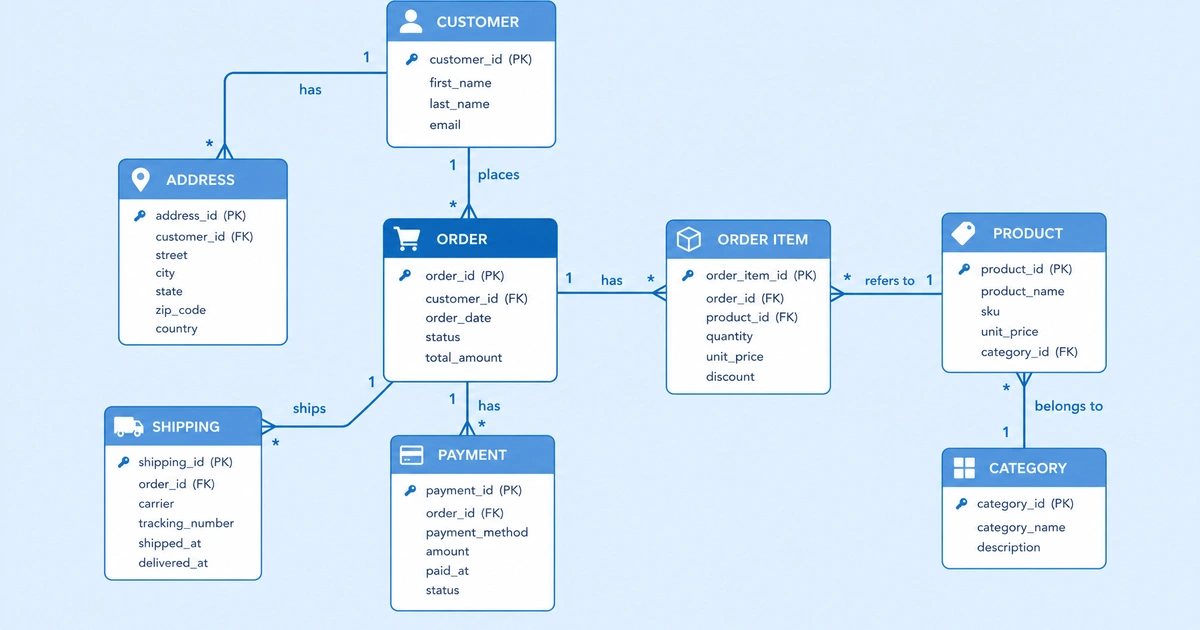
鸦脚表示法(现代工具更常用):
- 矩形内直接列出属性
- 连线两端用符号表示基数:
- 单竖线 = 一(必须)
- 双竖线 = 一(且恰好一个)
- 鸦脚符号(三条线) = 多
- 圆圈 = 零(可选)
大多数图表工具默认使用鸦脚表示法,因为更紧凑。两种方式的概念完全相同,只是视觉语法不同。
常见错误
跳过中间表。 每个多对多关系都需要中间表。试图不用中间表表示 M:N,最终会导致用逗号分隔值塞进一个字段的奇怪方案,破坏数据库范式。
在图中塞太多属性。 展示一张 30 列表的所有字段的 ER 图会完全无法阅读。聚焦在主键、外键,以及少数能帮助说明实体用途的关键属性。完整的字段列表留给 schema 文档。
混淆实体和属性。 如果你在用户表上有一个 country 字段,问自己:除了国家名称,你还需要存储关于国家的其他信息吗?如果是,把国家做成实体。如果否,保持属性就行。
忽略可空性。 外键是否必填(非空)还是可选(可空),很重要——它决定了关系是强制的还是可选的。鸦脚表示法可以用圆圈(零)和竖线(一)符号来表达这一点。
先开始画图,后思考数据。 一上来就打开工具画 ER 图,往往会有结构性问题,改起来很痛苦。先花五分钟用文字列出实体和关系,再动手画图。
ER 图说到底只是让你的数据模型变得可读——对你自己、对你的团队、对后来加入项目的人。目标不是第一次就画出完美的图,而是建立一个可以随着系统演进不断修正的共同理解。
下一步
想动手画第一张 ER 图?打开免费的在线 ER 图工具,免注册、内嵌编辑器,并已加载ER 图模板(包含常见的实体和关系结构,可以直接套用到你的项目里)。
如果你对其他建模方式也感兴趣,可以看看 UML 图的类型,了解什么时候用 ER 图、什么时候用类图或其他 UML 图。