System design diagrams translate architecture decisions into a visual language that engineers, product managers, and stakeholders can read together. Whether you're preparing for a technical interview, documenting an existing system, or planning something new, the ability to draw a clear system design diagram is a fundamental engineering skill.
This guide covers the components every system design diagram needs, how to structure and draw one from scratch, and walkthroughs of three common architectures.
Why Diagrams Matter in System Design
A system design description in prose is inherently ambiguous. "The service reads from the database" — which service? Which database? Is this synchronous? Does it go through a cache first?
A diagram makes these relationships explicit. Every arrow is a data flow. Every box is a component. Every label on a connection is a protocol or contract. There's no room for the kind of ambiguity that costs teams hours in clarification meetings or weeks in misimplemented integrations.
Diagrams are also how system design interviews are evaluated. The candidate who draws as they talk, who makes the data flow visible and the scaling decisions explicit, is far easier to assess than one who explains architecture purely in words.
The Core Components of a System Design Diagram
Most systems, regardless of scale or domain, are composed of the same set of building blocks:
Clients
The entry points into your system. These are typically:
- Web browsers accessing via HTTP
- Mobile apps (iOS, Android) using REST or GraphQL APIs
- Third-party services consuming your API
- Internal services calling your API programmatically
Draw clients as boxes on the left edge (or top) of the diagram. Arrows from clients point toward your system.
Load Balancers and API Gateways
The layer that receives all incoming requests and routes them to the appropriate service. A load balancer distributes traffic across multiple instances of the same service. An API gateway also handles authentication, rate limiting, and request transformation.
Common examples: Nginx, AWS ALB, AWS API Gateway, Cloudflare.
In diagrams, the load balancer sits directly behind the client layer and in front of your application services.
Application Services
The business logic layer. For a simple application, this might be a single service. For a larger system, it's typically multiple microservices, each responsible for a specific domain (user service, payment service, notification service).
When drawing services:
- Give each service a clear name based on what it does
- Show which services talk to each other
- Label the communication method on the arrows (REST, gRPC, message queue)
Databases and Storage
Every system stores data somewhere. The key distinctions to show in your diagram:
- SQL databases (PostgreSQL, MySQL): structured data, strong consistency, complex queries
- NoSQL databases (DynamoDB, MongoDB, Cassandra): flexible schema, horizontal scaling, eventual consistency
- Cache (Redis, Memcached): fast reads, ephemeral data, sits in front of the database
- Object storage (S3): files, images, videos, large binary data
- Message queues (Kafka, RabbitMQ, SQS): async communication between services
Draw databases as cylinders, caches as cylinders with a different label, and object storage as a distinct box.
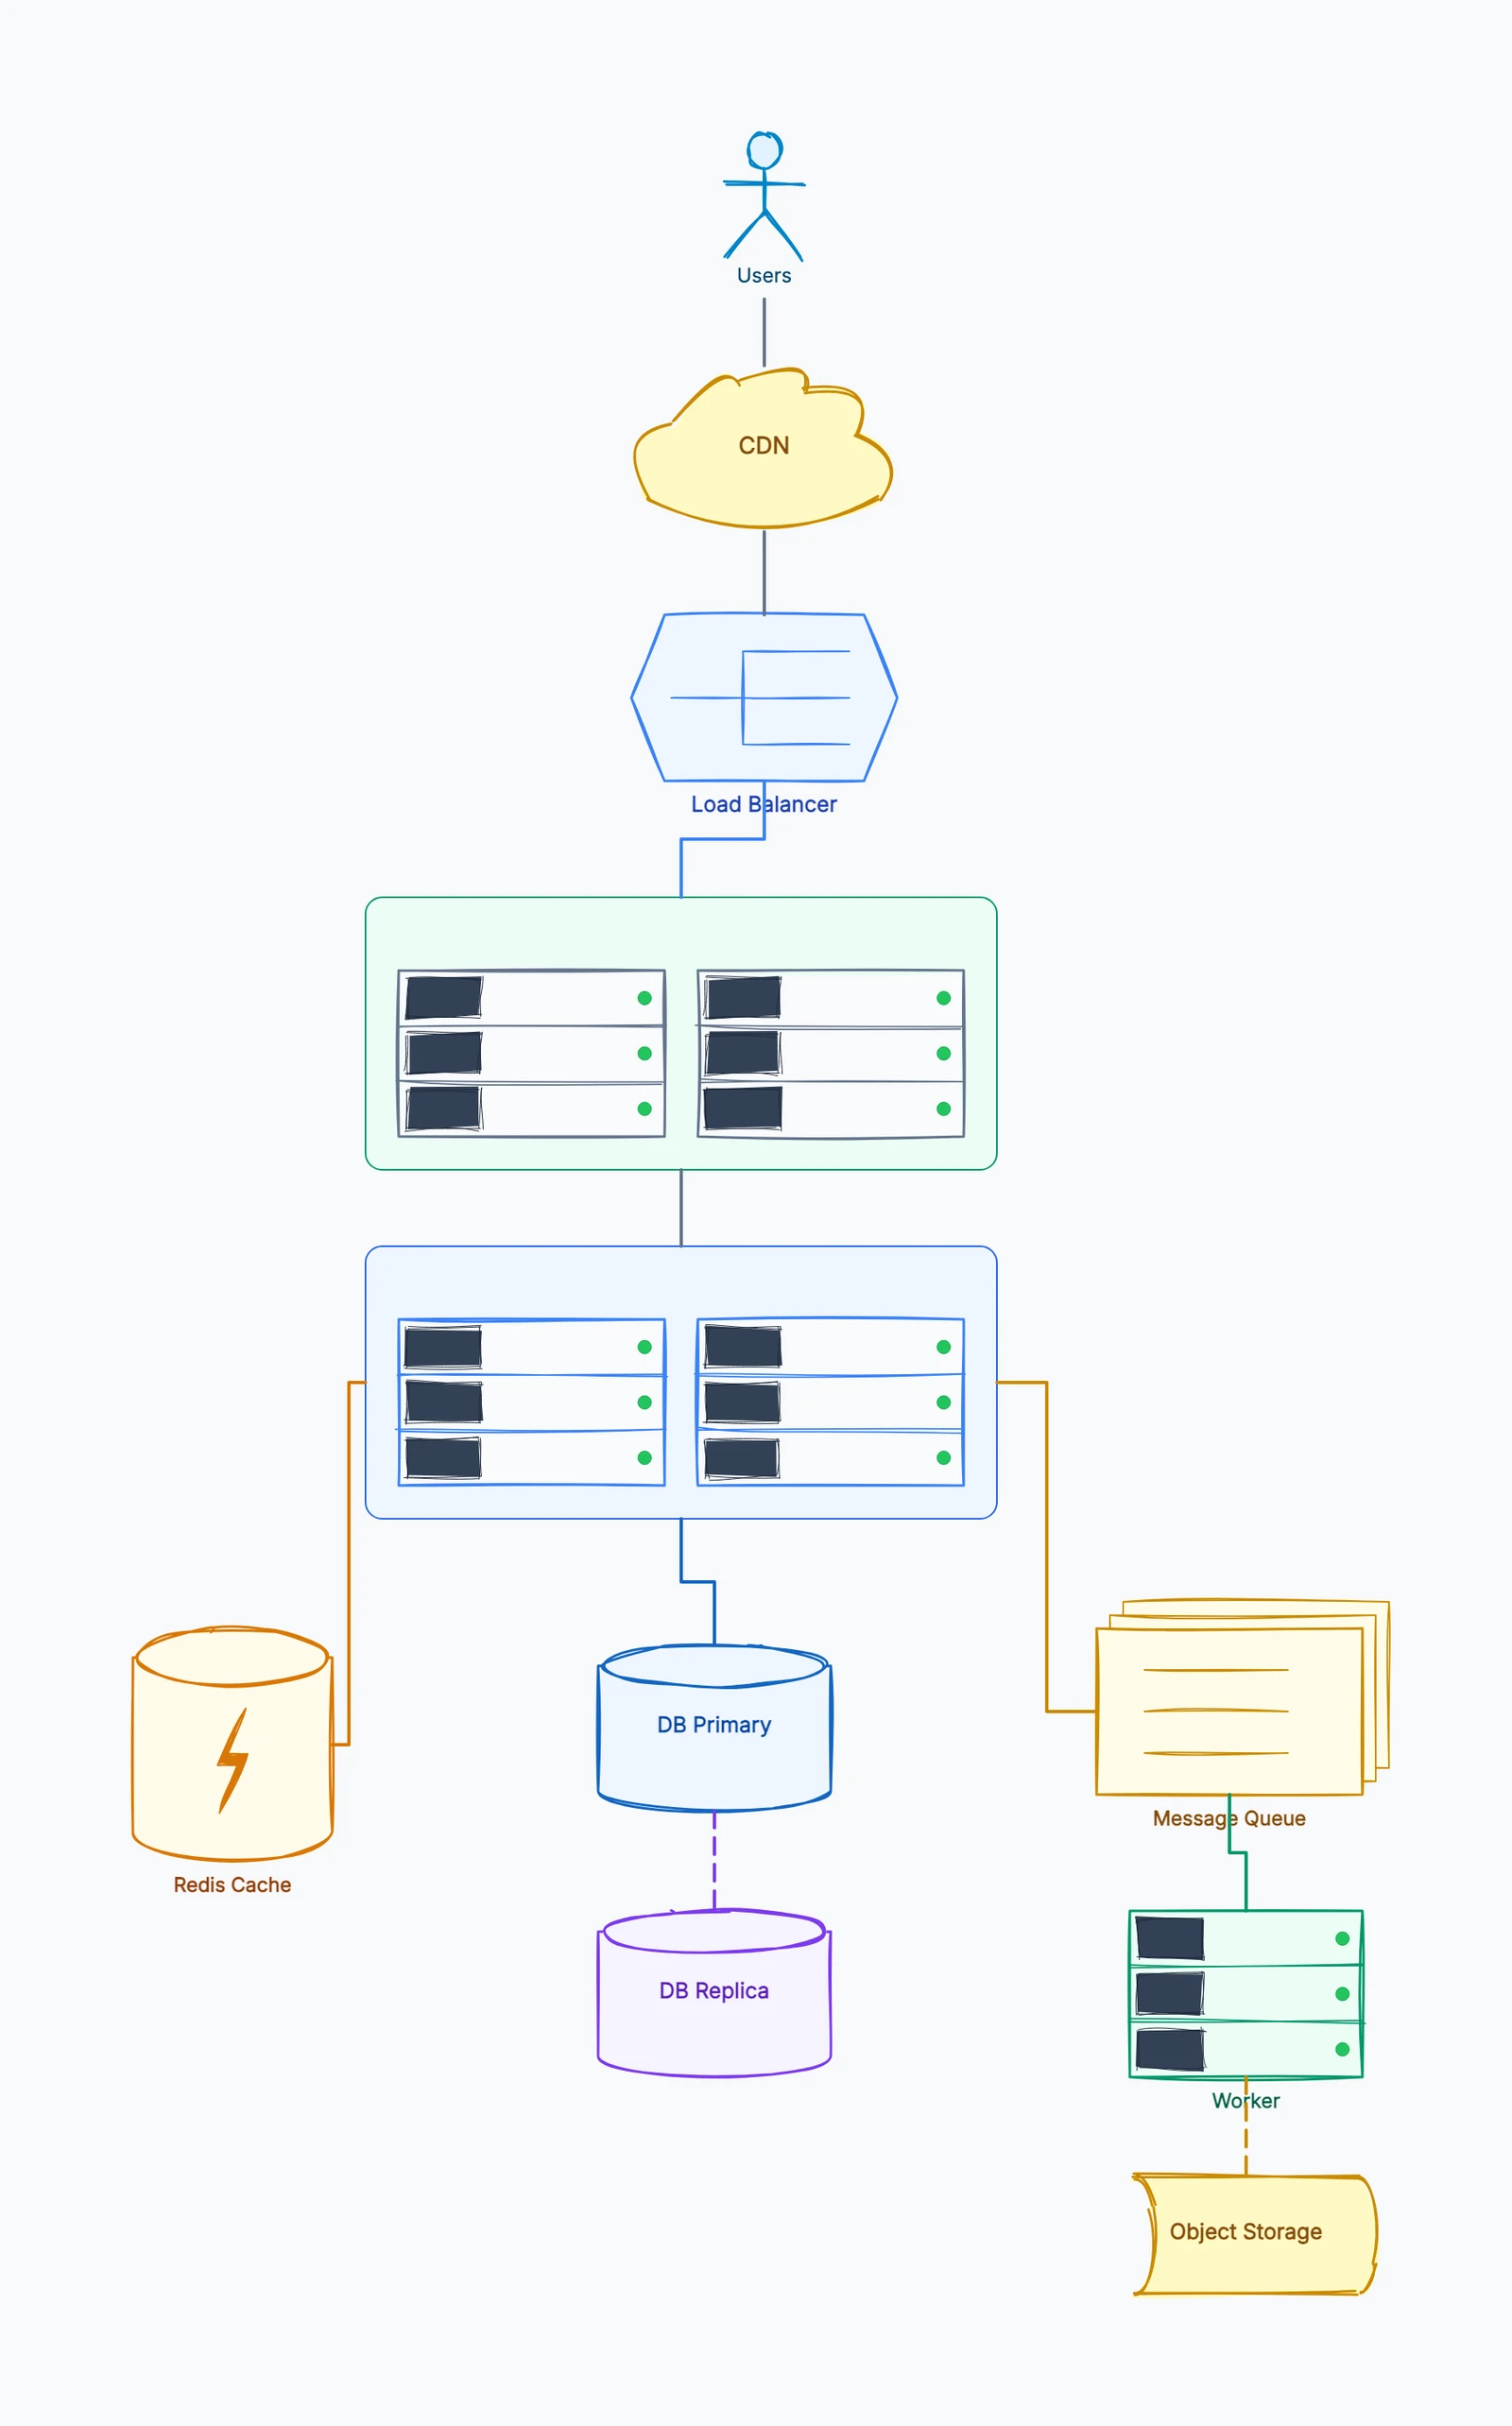
CDN
A Content Delivery Network caches static assets (images, CSS, JavaScript, video) at edge servers close to users, reducing latency and load on your origin servers. Show the CDN sitting between clients and your origin storage or servers.
External Services
Third-party dependencies: payment processors (Stripe), email providers (SendGrid), SMS gateways (Twilio), push notification services, analytics platforms. Draw these at the edges of your diagram with arrows showing the direction of the call.
How to Draw a System Design Diagram
Start high-level. Begin with five to six major components. Don't try to show every microservice, every database table, or every edge case in the first pass. Get the macro structure right first.
Show data flow with arrows. Arrows represent data moving through the system. Arrowheads indicate direction. A two-headed arrow means the communication is bidirectional. Always label arrows with what's being communicated or the protocol being used.
Group related components. Use frames, dashed borders, or color coding to show which components belong to the same domain or service boundary. This makes it immediately clear what's inside your system and what's external.
Label everything. Service names, database types, protocols, and key decisions should all be labeled. "Service" and "DB" are not useful labels. "User Service" and "PostgreSQL (users)" are.
Think in layers. A well-drawn system design flows from left to right (or top to bottom) through logical layers: client → load balancer → application services → databases → external services.
Example 1: URL Shortener
A URL shortener (like bit.ly) is a classic system design example. The core behavior: a user submits a long URL and gets back a short code; another user visits the short URL and gets redirected to the long URL.
Components:
- Client: browser or API consumer
- Load Balancer: distributes traffic across API servers
- URL Shortener Service: handles create and redirect requests
- Database (SQL): stores the mapping of short code → long URL
- Cache (Redis): stores frequently accessed mappings for fast redirects
- Analytics Service: records click data asynchronously
- Message Queue: decouples the analytics write from the redirect response
Data flow:
- Create: Client → LB → Service → DB (write mapping) + return short URL
- Redirect: Client → LB → Service → Cache (hit? redirect immediately) → DB (miss? read, cache it, redirect) → Analytics (async via queue)
The cache is critical here: redirects are far more frequent than creates, and cache hits avoid a database read on every redirect.
Example 2: Chat Application
A real-time chat system (like Slack or WhatsApp) requires sustained connections, not just request-response.
Components:
- Client: mobile or web app
- WebSocket Gateway: maintains persistent connections for real-time messaging
- Chat Service: manages rooms, delivers messages
- Presence Service: tracks online/offline status
- Database (NoSQL, e.g., Cassandra): stores message history (write-heavy, time-ordered)
- Cache (Redis): stores active session data and recent messages
- Message Queue (Kafka): fan-out delivery to multiple recipients
- Notification Service: handles push notifications for offline users
- Object Storage (S3): stores images and file attachments
- CDN: serves media files
Key design choices to show:
- WebSocket connections for real-time delivery (not polling)
- NoSQL database for message storage (time-series access patterns, write-heavy)
- Fan-out via queue: when a message is sent to a group, the queue distributes it to all member sessions
Example 3: Social Media News Feed
A news feed (like Twitter or Instagram's home feed) involves two hard problems: generating the feed efficiently and delivering it at scale.
Components:
- Client: mobile or web app
- API Gateway / Load Balancer
- Feed Service: serves the user's feed
- Post Service: handles creating new posts
- User Service: manages followers and following relationships
- Fan-out Service: distributes new posts to followers' feeds
- Feed Cache (Redis): pre-computed feed for each user (fast reads)
- Post Database (NoSQL): stores post content
- Social Graph Database (Graph DB or SQL): stores follow relationships
- Media Storage (S3 + CDN): stores and serves images and video
Two feed approaches (worth showing the tradeoff):
Push model (fan-out on write): When a user posts, immediately write to every follower's feed cache. Fast reads, expensive writes for users with millions of followers.
Pull model (fan-out on read): When a user opens the app, compute their feed by fetching recent posts from everyone they follow. Slow reads, no write overhead.
Hybrid: Push for normal users, pull for celebrities with millions of followers. Most real systems use this.
Common Mistakes in System Design Diagrams
No data flow direction. Arrows without arrowheads, or arrows that go in the wrong direction, create confusion about how data actually moves.
Missing the cache. Most systems that handle significant read traffic use a cache in front of the database. If it's not in the diagram, it looks like a design gap.
Only the happy path. Real system design accounts for failures: what happens when the database is unavailable? When the cache is cold? These aren't optional considerations.
Trying to show everything. A diagram that shows every endpoint, every field, and every possible state is illegible. Draw at the right level of abstraction for your audience.
No labels on arrows. "Something goes here" is not a system design. Label every arrow with what's being transmitted or the protocol.
Start Drawing
If you want to practice, try building one of these architectures yourself. CodePic offers a system design template with pre-built components for clients, services, databases, caches, and queues. For microservices-heavy diagrams, the microservices template includes service boundaries, API gateways, and inter-service communication patterns.