甘特图是项目管理中用于展示项目进度的横向条形图。任务列在左侧,时间轴沿横向延伸,每个任务以横向条形表示,从开始日期延伸到结束日期。条形之间的箭头表示依赖关系——必须在另一个任务开始之前完成的任务。
甘特图由 Henry Gantt 在 20 世纪初开发,最初用于追踪制造业排期。今天它已成为工程、建筑、市场营销、产品研发以及几乎所有管理多步骤工作的领域传达项目时间线的标准格式。
甘特图的价值不只在视觉化本身——更在于构建它的过程迫使你做的事情。你必须列出每项任务、估算每项任务需要多长时间、确定哪些任务依赖哪些任务。这个过程在进度延迟发生之前就会暴露规划上的漏洞。
如果你想自己动手做一张甘特图,可以参考我们的甘特图制作教程。想快速上手的话,试试我们的免费甘特图模板。
甘特图展示什么
一张完整的甘特图同时传达多个信息:
任务和工期。 每个条形代表一个工作单元。条形左边缘的位置表示任务开始时间,右边缘表示结束时间。长度代表需要多长时间。
项目时间线。 横轴是日历——根据项目长度选择天、周或月。扫过任意一周,就能看到那一周发生的所有事情。
依赖关系。 连接条形的箭头表示顺序约束。从任务 A 到任务 B 的依赖箭头,意味着任务 B 在任务 A 完成之前无法开始。依赖关系把任务列表变成有计划的顺序。
关键路径。 最长的不间断依赖任务链决定了项目最早能完成的日期。关键路径上任何任务的延误都会延迟整个项目。不在关键路径上的任务有「浮动时间」——可以在一定范围内延迟而不影响最终日期。
里程碑。 重大事件、截止日期或交付物在时间线上以菱形符号标注。里程碑是时间点,不是持续时间——没有条形。
资源分配。 很多甘特图包含一列显示每项任务的负责人。这让资源冲突变得可见:当同一个人负责的两项任务时间重叠时,图表就会揭示这种双重预定。
进度追踪。 工作开始后,条形可以部分填充来显示每项任务完成的百分比。
甘特图核心概念
关键路径
理解关键路径对于有效使用甘特图至关重要。关键路径是从开始到结束最长的依赖任务序列,决定了项目所需的最短时间。
如果一个项目有三条并行的工作线,关键路径穿过其中最长的那条。其他工作线可以有相当于它们与最长线差值的延迟空间——那就是它们的浮动时间。
了解关键路径告诉你把精力集中在哪里。非关键任务的延迟令人不快。关键路径任务的延迟就是项目延迟。
浮动时间(富余时间)
浮动时间是任务可以延迟而不影响项目最终日期的时间量。关键路径上的任务浮动时间为零——任何延迟都会立即影响最终日期。不在关键路径上的任务有正的浮动时间。
浮动时间让你在资源分配上有灵活性。如果关键路径任务需要更多资源来避免延迟,有时可以从有浮动时间的非关键任务中调配资源。
基准 vs. 实际
专业的甘特图通常显示两个版本的进度:基准(原始计划)和实际(计划的演变情况)。对比两者显示项目在哪些地方偏离了,偏离了多少。
真实世界的甘特图示例
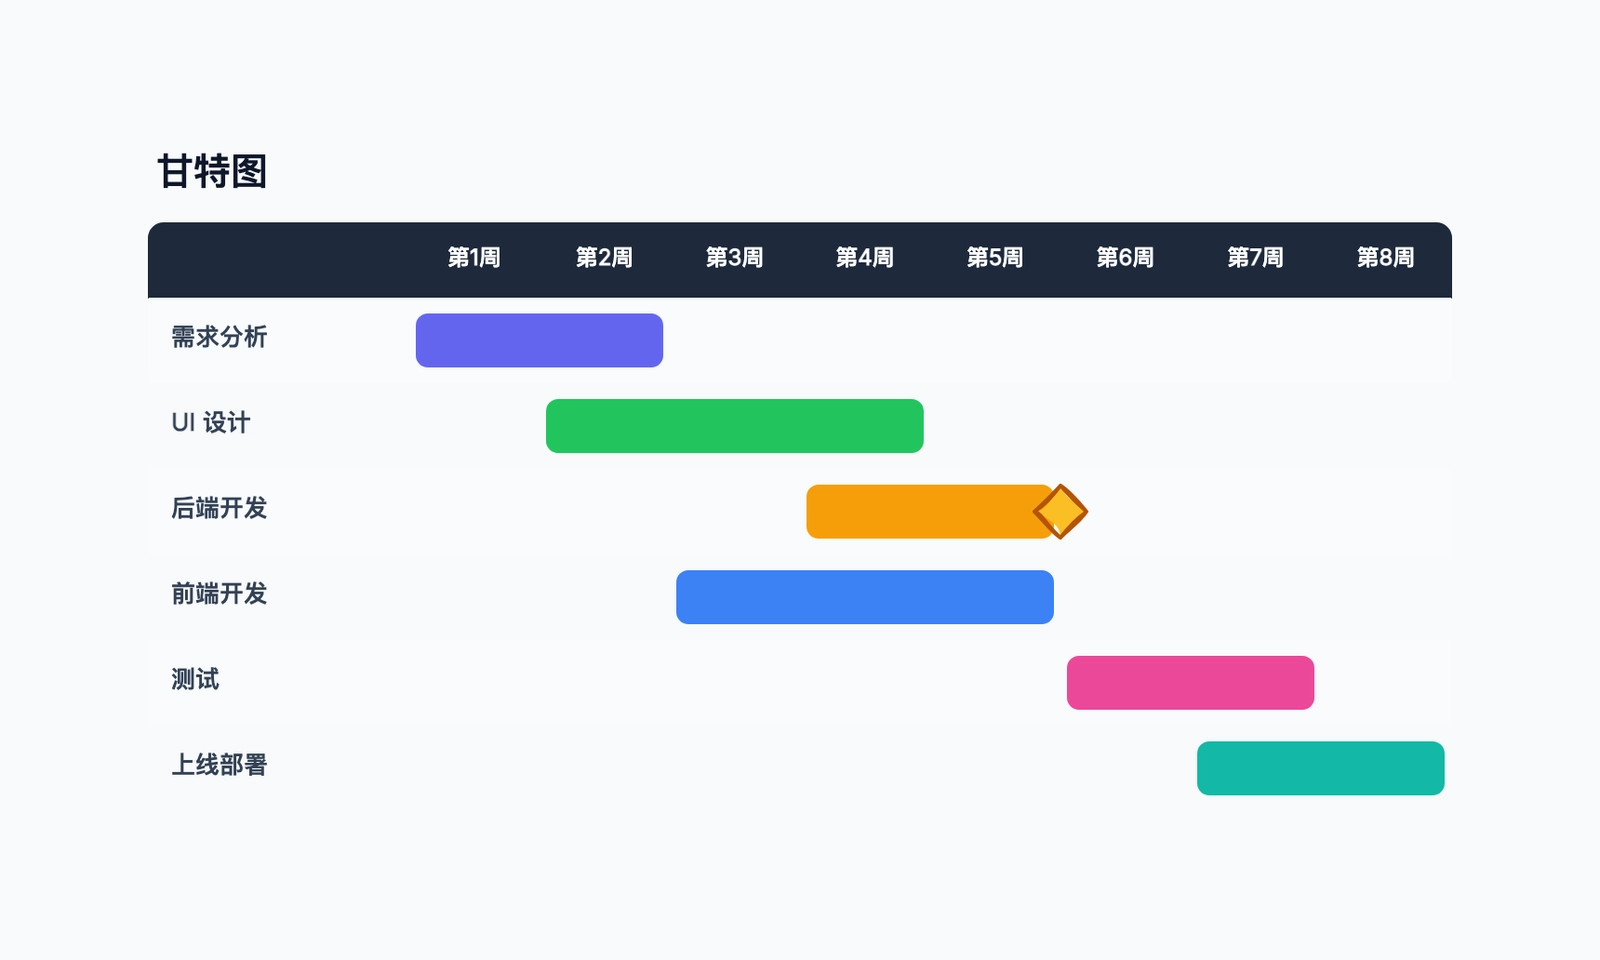
软件产品发布
为新功能上线规划的团队:
| 任务 | 负责人 | 第1-2周 | 第3-4周 | 第5-6周 | 第7-8周 |
|---|---|---|---|---|---|
| 需求确认 | PM | ████ | |||
| UI 设计 | 设计 | ████ | |||
| 后端 API | 研发 | ████ | ████ | ||
| 前端开发 | 研发 | ████ | |||
| QA 测试 | QA | ████ | |||
| 上线 ▲ | 第8周末 |
关键路径:需求确认 → UI 设计 → 前端开发 → QA → 上线。后端 API 与 UI 设计并行,有相当于两者工期之差的浮动时间。
营销活动
内容和活动团队:
| 任务 | 第1周 | 第2周 | 第3周 | 第4周 | 第5周 | 第6周 |
|---|---|---|---|---|---|---|
| 策略 | ████ | |||||
| 创意简报 | ████ | |||||
| 文案撰写 | ████ | ████ | ||||
| 设计素材 | ████ | |||||
| 法务审核 | ████ | |||||
| 活动上线 ▲ | 结束 |
法务审核在关键路径上——如果它超时,活动上线日期就要推迟。
建筑装修项目
建筑翻新工程:
| 任务 | 第1个月 | 第2个月 | 第3个月 | 第4个月 | 第5个月 |
|---|---|---|---|---|---|
| 审批手续 | ████ | ||||
| 拆除 | ████ | ||||
| 电气工程 | ████ | ||||
| 管道工程 | ████ | ||||
| 石膏板 | ████ | ||||
| 精装 | ████ | ||||
| 交付 ▲ | 结束 |
电气和管道工程并行进行(同月,不同施工队),但两者都必须完成后才能开始石膏板工程。
研究和报告项目
咨询团队交付客户报告:
| 任务 | 第1周 | 第2周 | 第3周 | 第4周 |
|---|---|---|---|---|
| 数据收集 | ████ | ████ | ||
| 分析 | ████ | |||
| 报告撰写 | ████ | |||
| 客户评审 ▲ | 结束 |
简单的线性依赖链——整个项目都在关键路径上,浮动时间为零。
如何建甘特图
第一步:列出所有任务。 先头脑风暴——把需要完成的所有事情都写下来,然后按阶段整理。任务粒度要合适:具体到一个人能负责、你能估算工期,但又不要细到图表有 200 行。
第二步:估算工期。 每项任务需要多长时间?对估算要诚实,包括评审周期、交接时间和意外问题的缓冲。真的不知道需要多久的任务,需要标记出来并预留更多缓冲。
第三步:确定依赖关系。 逐一检查任务,识别哪些任务在另一个未完成前无法开始。写成:「任务 B 需要任务 A 完成」。依赖类型有多种,但「完成才能开始」(任务 B 在任务 A 完成时开始)覆盖了大多数场景。
第四步:识别可并行的工作。 很多任务之间没有依赖关系,可以同时进行。识别并行工作线是缩短整体项目时间线的方式。各需要两周的两项任务如果并行进行,总共只需要两周而不是四周。
第五步:画出图表。 从项目开始日期出发,根据依赖关系和并行工作排布任务,用箭头连接有依赖关系的任务。
第六步:找出关键路径。 追踪最长的有依赖关系的连续任务链,那就是你的关键路径。用明显的方式标注它——进度风险就在这里。
第七步:分配负责人。 每项任务需要一个具名的负责人。扫视图表,找出资源冲突——同一个人被分配了两项或更多时间重叠的任务。
什么时候用甘特图
有明确范围和多个依赖任务的项目。 如果你知道需要做什么、每个步骤大概多久、哪些任务依赖哪些任务,甘特图是正确的工具。
向利益相关方传达进度。 甘特图是向任何需要了解时间线但不需要知道每个细节的人展示项目进度的标准格式。
追踪执行进度。 项目开始后,图表成为计划与实际的对比,揭示哪些地方超前或落后。
资源规划。 在时间轴上看到所有任务,就能发现某人在哪个时段工作过载、哪个时段有空余产能。
什么时候不适合用甘特图
范围不断演变的敏捷研发。 甘特图基于一个计划。在需求每个 Sprint 都在变化的环境里,计划在墨迹未干时就已经错了。看板和 Sprint 规划更适合这类团队。(如果不确定该用哪个,可以看看看板 vs 甘特图对比。)
早期探索阶段。 如果还不知道任务是什么,就无法建甘特图。先探索(思维导图、白板),再规划。
持续运营型工作。 支持队列、内容流水线和维护工作没有开始和结束——它们是持续的。看板是更好的工具。
非常短的项目。 五项任务的两天冲刺不需要甘特图,一个清单就够了。
甘特图 vs. 其他规划工具
| 工具 | 最适合 |
|---|---|
| 甘特图 | 有依赖关系和明确截止日期的多任务项目 |
| 看板 | 无固定项目终点的持续流动工作 |
| Sprint 看板 | 固定周期的迭代研发 |
| 项目清单 | 没有并行性的简单线性任务 |
| 思维导图 | 任务定义前的范围探索 |
| 路线图 | 以主题或季度为单位的长期规划 |
常见问题
用什么软件做甘特图? 专用工具:TeamGantt(1 个项目免费版)、GanttProject(免费桌面应用)。带甘特图视图的项目管理平台:Notion(时间线视图)、ClickUp(免费版)。图表工具:CodePic 和 draw.io 都有甘特图模板。详细对比可以看我们的免费甘特图工具评测。
甘特图应该规划多远的未来? 不要超出你能合理估算的范围。六个月的图表里最后两个月全是猜测,这不是计划——是带视觉效果的猜测。更好的做法是前两个月详细规划,后几个月在阶段层面规划。
谁应该看甘特图? 所有参与项目交付的人,以及需要了解时间线的利益相关方。甘特图作为共享参考最有效,不该是私下的规划工具。
甘特图和路线图有什么区别? 路线图是显示方向的战略文件,时间跨度以季度或年计。甘特图是显示具体任务的运营文件,时间跨度以天或周计。路线图用于对齐;甘特图用于执行。