实体关系图(ER 图)是数据库数据组织方式的可视化地图。它展示系统中存在哪些类型的数据(实体)、每种类型存储哪些信息(属性),以及不同类型的数据之间的关联方式(关系)。
ER 图是在写任何 SQL 之前设计数据库的标准工具。它也是向新团队成员、利益相关方或需要查询数据但不想读原始 schema 文件的开发人员,快速传达现有数据库结构的最好方式。
这个图表由 Peter Chen 在 1976 年开发,此后一直是软件和数据库设计的核心工具。尽管已有近 50 年的历史,基本符号仍然在每一个计算机科学项目中讲授,并被用于每一个以数据库为核心的软件项目中。
三个核心构建块
实体
实体是系统需要存储信息的「事物类型」。在数据库中,实体对应表。用自然语言描述一个系统时,名词通常是实体候选:
- 电商系统有商品、订单、客户、分类、供应商
- 博客系统有文章、作者、评论、标签
- 图书馆系统有图书、会员、借阅记录、作者
- 学校系统有学生、课程、教师、选课记录
判断某物是否应该成为实体的方法:它是否需要自己的一组属性?客户需要姓名、邮箱和地址。国家(如果只需要一个名称)可能只是客户表上的一个属性,而不需要自己的实体。
属性
属性是每个实体存储的数据字段,它们对应数据库表中的列。
客户: id、姓名、邮箱、手机号、地址、注册时间
商品: id、名称、描述、价格、库存数量、分类_id
订单: id、下单时间、状态、总金额、客户_id
每个实体有一个特殊属性:主键。主键是每条记录的唯一标识符——表中每一行的主键值都不同。通常是名为 id 的自增整数,但也可以是任何唯一值。
在 ER 图中,主键通常用下划线标注(陈式符号)或标记为「PK」(鸦脚符号)。
外键是引用另一个实体主键的属性——这是关系数据库中关系的实现方式。
关系
关系描述实体之间的连接方式。关系名称通常是动词:
- 客户下了订单
- 订单包含商品
- 文章由作者撰写
- 学生报名课程
每种关系都有基数——描述一个实体的多少个实例可以与另一个实体的多少个实例相关联。
理解基数
基数是 ER 图中最容易让人困惑的部分。它很重要,因为它决定了表结构和外键的位置。
一对一(1:1)
实体 A 中的每条记录恰好对应实体 B 中的一条记录,反之亦然。
示例: 一个用户有一份个人资料,一份个人资料属于一个用户。
在数据库中:外键可以放在任一张表上。通常把外键放在不那么核心的实体上。个人资料表上的 user_id 列指向用户表。
现实中的出现频率: 一对一关系相对少见。遇到时,考虑是否应该把两个实体合并成一张表。
一对多(1:N)
实体 A 中的一条记录对应实体 B 中的多条记录,但实体 B 中的每条记录恰好对应实体 A 中的一条记录。
示例: 一个客户可以下多个订单,但每个订单只属于一个客户。
在数据库中:外键放在「多」的一侧。订单表上有一个 customer_id 列,指向客户表。
现实中的出现频率: 这是最常见的关系类型。大多数数据模型都以一对多关系为主。
多对多(M:N)
实体 A 中的多条记录对应实体 B 中的多条记录。
示例: 一个商品可以出现在多个订单中,一个订单可以包含多个商品。
在数据库中:无法直接实现 M:N。需要一个中间表(也称为关联表、桥接表或连接表),位于两个实体之间,存储关系。
对于商品和订单,中间表通常叫 OrderItem 或 OrderLine,包含:
order_id(外键,指向订单表)product_id(外键,指向商品表)quantity(关系特有的额外属性)unit_price(下单时的价格——存放在这里是因为价格会变动)
现实中的出现频率: 多对多关系在任何存在「属于多个」场景的地方都很常见。
ER 图符号表示法
你会遇到两种主要的符号风格:
陈式表示法(原始版本)
- 矩形表示实体
- 椭圆表示属性(通过线条与实体相连)
- 菱形表示关系名称(连接两个相关实体)
- 关系线旁边的数字或字母(1、N、M)表示基数
陈式表示法在很多数据库教材中讲授,是画 ER 图的「教科书」方式。表达更冗长但很明确。
鸦脚表示法(现代标准)
- 矩形表示实体,属性列在矩形内
- 实体之间用线条表示关系
- 线条末端的符号表示基数:
- 单竖线
|= 恰好一个(必须) - 双竖线
||= 恰好一个(且不超过一个) - 鸦脚符号
<(三条线) = 多个 - 圆圈
O= 零个(可选)
- 单竖线
鸦脚表示法是大多数现代图表工具(draw.io、Lucidchart、CodePic)使用的符号,因为更紧凑,一眼更容易读懂。关系线每端的符号告诉你各侧的最小值和最大值。
一条从客户到订单的线,如果读作 ||—<,意思是:每个订单恰好有一个客户(|| 端),一个客户可以有多个订单(< 端)。
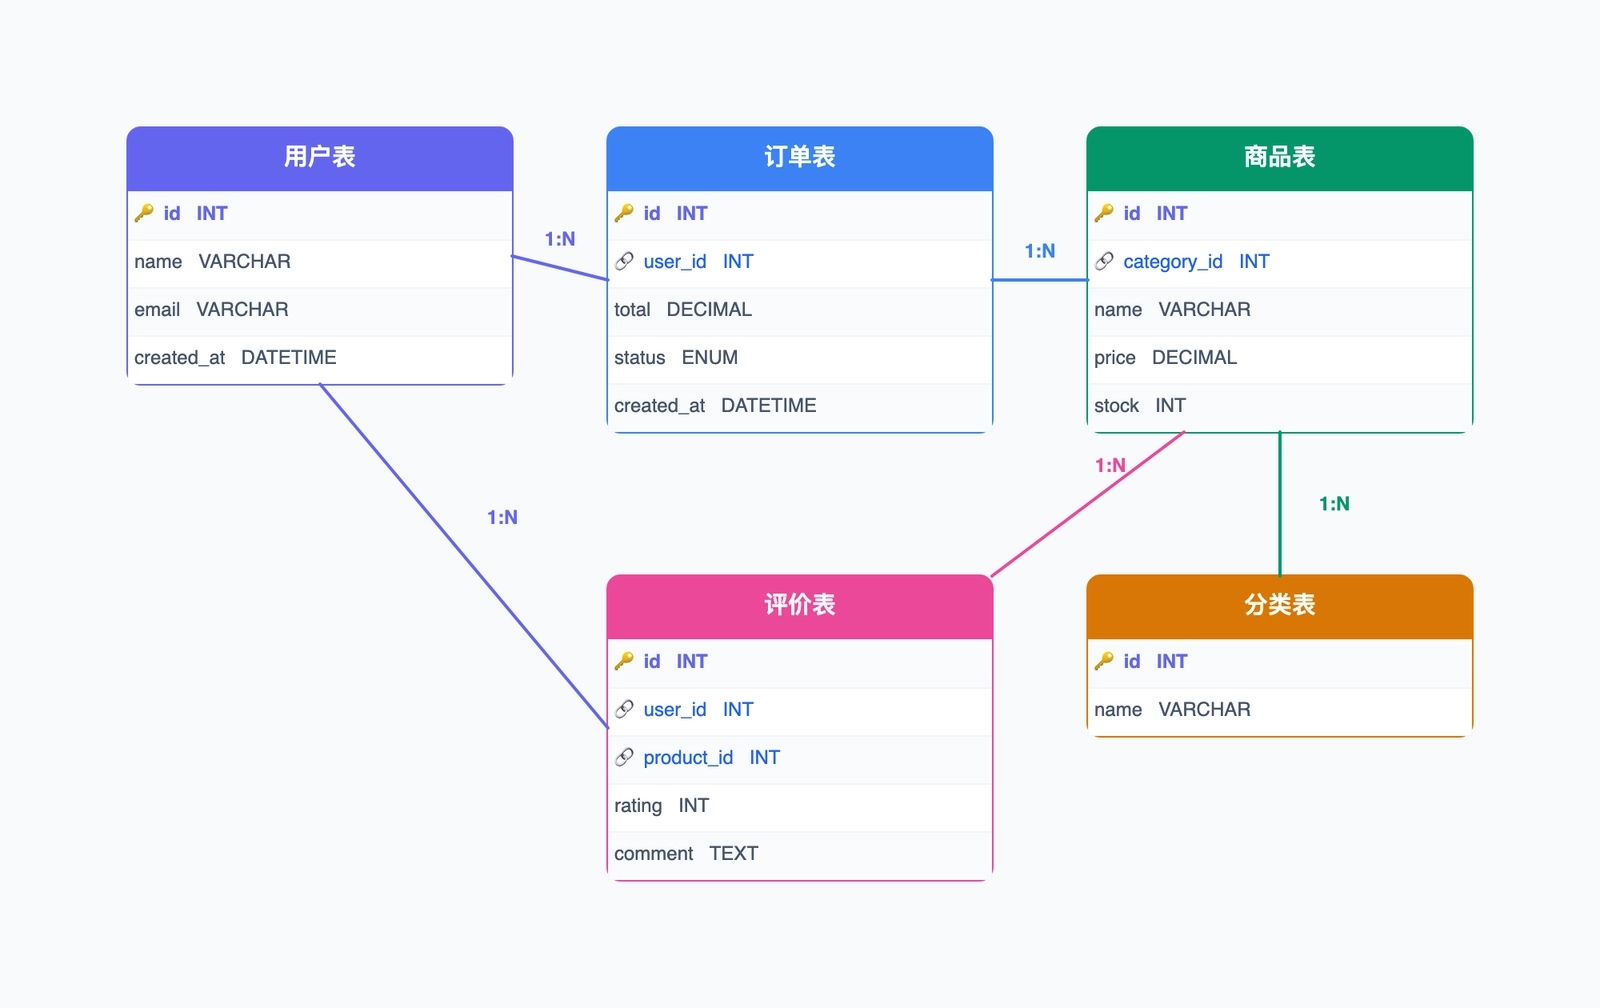
完整示例:电商数据库
以下是简化版电商数据库的 ER 图:
实体和关键属性:
- 客户(id PK、姓名、邮箱、地址)
- 订单(id PK、下单时间、状态、客户_id FK)
- 商品(id PK、名称、价格、库存数量、分类_id FK)
- 分类(id PK、名称、父分类_id FK)
- 订单项(订单_id FK、商品_id FK、数量、下单时单价)
关系:
- 客户
1:N订单(一个客户可以有多个订单) - 订单
M:N商品(通过订单项中间表) - 商品
N:1分类(每个分类有多个商品) - 分类
N:1分类(自引用,用于多级分类)
值得关注的设计决策:
下单时单价在订单项上,而不是商品上。商品价格会随时间变化,查看历史订单时,你需要的是下单当时的价格,而不是今天的价格。将其存储在订单项上保留了这一信息。
分类上的 父分类_id 引用同一张表(自引用),支持多级分类:电子产品 → 笔记本电脑 → 游戏本。顶级分类的 父分类_id 为 null。
如果想把这个例子变成可编辑图表,可以从 ER 图模板开始。模板已经带有实体框、关系连接线和基数标签,你可以把注意力放在数据模型本身,而不是从零搭符号。
如何画 ER 图
想要更详细的教程和更多案例,可以参考 ER 图怎么画。
第一步:识别实体。 阅读系统描述或需求,写下所有反复出现的名词,这些是实体候选。去掉那些实际上只是属性伪装成概念的东西。
第二步:定义属性。 对每个实体,列出需要存储的数据,标注主键,标注哪些属性将成为外键。
第三步:识别关系。 逐对检查实体,问:它们之间如何关联?写成「A [动词] B」和「B [动词] A」,这样既能得到关系,又能帮助厘清基数。
第四步:确定基数。 对每种关系:一个 A 可以对应多个 B 吗?一个 B 可以对应多个 A 吗?这决定了关系是 1:1、1:N 还是 M:N。
第五步:添加中间表。 对每个 M:N 关系,添加一个包含指向两个实体外键的中间表,并加入属于该关系本身的属性(数量、日期、价格等)。
第六步:添加外键。 对每个 1:N 关系,在「多」的一侧添加外键列,指向「一」的一侧的主键。
第七步:画出图表。 将实体放置为方框,用线条连接,在每端添加基数符号。
什么时候用 ER 图
开始任何以数据库为核心的应用之前。 在写代码之前画出 ER 图,让结构问题在最容易修复的时候就暴露出来。
加入一个现有项目时。 ER 图传达数据模型的速度远快于阅读迁移文件或 schema 转储。
规划迁移或重构时。 把当前结构和目标结构并排可视化,让需要改变的内容一目了然。
调试数据完整性问题时。 ER 图帮助识别缺失的外键、错误的基数假设或导致数据问题的循环依赖。
在技术面试和设计讨论中。 ER 图是传达数据库设计想法的标准格式——能够快速画出一张是实用的技能。
常见错误
混淆实体和属性。 如果用户表上有一个 country 字段,问自己:我需要存储关于国家的、超出其名称的其他信息吗?如果不需要,就保持为属性。如果需要人口、首都或其他数据,把它提升为实体。
忘记中间表。 每个 M:N 关系都需要一个。试图不用中间表存储 M:N 关系,会导致在一列中用逗号分隔多个 ID——这是一个臭名昭著的反模式,会破坏查询性能和数据完整性。
忽略可空性。 外键是必须的(非空)还是可选的(可空)是一个设计决策。订单上可空的 customer_id 意味着允许访客下单;非空的 customer_id 意味着每个订单必须关联一个客户。这应该在设计时明确。
过早规范化。 不是所有相关数据都需要自己的表。目标不是最高程度的规范化,而是适合应用查询模式的规范化程度。
画图之前不思考查询。 最好的 ER 图是让你最重要的查询容易写的那种。设计结构时要考虑你需要一起检索哪些数据。
常见问题
ER 图和 schema 有什么区别? schema 是实际的数据库结构——表、列和约束的 SQL 定义。ER 图是代表相同概念的可视化图表。ER 图更容易沟通;schema 是被实现的东西。
每个项目都需要画 ER 图吗? 对于任何有超过几张表的项目,需要。画 ER 图花费的时间几乎总是少于后来发现结构问题所损失的时间。
画 ER 图最好用什么软件? draw.io 免费且出色。Lucidchart 有良好的模板。CodePic 支持手绘风格的 ER 图。对于纯粹的图表目的,这些都可以。对于需要与数据库保持同步的文档,dbdiagram.io 等专业工具允许用文本语法定义 ER 图并自动生成图表。
下一步
准备好创建自己的 ER 图了吗?试试我们的 ER 图模板,包含常用的实体和关系结构,可以直接用于你的数据库设计。
如果你还在使用其他类型的图表,可以看看 UML 图的类型,了解什么时候用 ER 图、什么时候用类图或其他建模方式。