A supply chain diagram is how you see a product's whole journey at once — who makes it, who stores it, who moves it, and who finally buys it. It is the difference between knowing your suppliers by name and actually seeing the path a product takes from raw material to the hands of a customer.
This guide walks through what a supply chain diagram should show, how the two flows work, and how to build one. Then it works through three concrete examples — coffee, automotive, and pharmaceutical — and the mistakes that make these diagrams confusing. You can adapt the supply chain diagram template and edit every entity directly in the browser.
What a supply chain diagram shows
A supply chain diagram is not a to-do list and it is not a generic process map. A process map follows one path of tasks and decisions inside a single workflow — submit the request, review it, build it, ship it. A supply chain diagram tracks several independent entities and the handoffs between them. The question is not "what happens next in this procedure" but "which company or department takes ownership next, and what do they pass along?"
A workable supply chain diagram answers four questions:
- which entities touch the product, in order;
- what physical goods move between them (the material flow);
- what information moves the other way (orders, forecasts, demand);
- who owns each stage and what that stage actually does.
The moment you can answer those four questions for your own product, you have a diagram that is useful for onboarding, audits, supplier conversations, and spotting where a single point of failure sits.
The five stages, left to right
Most supply chain diagrams share the same backbone, even when the industries look nothing alike. The chain runs left to right, from upstream (raw material) to downstream (customer):
- Supplier — the source of raw material or components.
- Manufacturing — where inputs become the product.
- Warehousing — where finished goods are stored and picked.
- Distribution — where goods are routed and delivered.
- Customer — the end buyer or consumer.
Not every chain needs all five as separate boxes. A grocery chain might collapse warehousing and distribution into one distribution center. A car company might split "supplier" into three tiers. The backbone is a starting point, not a straitjacket — branch it where your chain genuinely differs.
The two flows: material and information
This is the part most people leave out, and it is the part that makes a supply chain diagram worth drawing in the first place.
Material flows forward. Goods move from supplier to manufacturing to warehousing to distribution to the customer. This is the physical stuff: green beans, steel, active pharmaceutical ingredients, finished product. You draw it as solid arrows pointing right.
Information flows back. Orders, demand forecasts, and replenishment signals travel the opposite direction, from the customer back upstream to the supplier. You draw it as a dashed line pointing left, usually routed along the bottom of the chain.
When both flows are on the page, the diagram stops being a one-way arrow and becomes a loop: goods go down, demand comes back, and the supplier knows how much to produce next. That loop is the whole point of supply chain management, and it is the single most valuable thing a supply chain diagram can make visible.
How to build a supply chain diagram
1. List the real entities
Write down every company or department that touches the product, in the order goods move through them. Use real names or roles, not "logistics" for everything. If a supplier, a warehouse, and a distributor are three different parties, they are three different boxes.
2. Place them left to right
Lay the entities out on a horizontal chain: supplier on the left, customer on the right, the others in between. Horizontal reads naturally for a chain, and it leaves room under the row for the return information flow.
3. Draw the material flow forward
Connect each entity to the next with a solid arrow pointing right. Label what moves at each handoff — green beans, roasted beans, finished product — so the flow is concrete rather than a generic "goods."
4. Draw the information flow back
Add a dashed arrow from the customer back to the supplier, routed below the chain. Label it "orders and demand." This is the line that tells the upstream stages how much to make next.
5. Color each stage by role
Give each stage a distinct color so the chain reads at a glance. The color is not decoration; it is how a reader skims the diagram and sees "these are five separate owners, not one blurred pipeline."
6. Add ownership and a legend
Put a short role note on each stage — "inventory and order picking," "stamping, welding, final assembly." Add a legend that distinguishes the solid material flow from the dashed information flow, so no one has to guess.
Coffee supply chain example
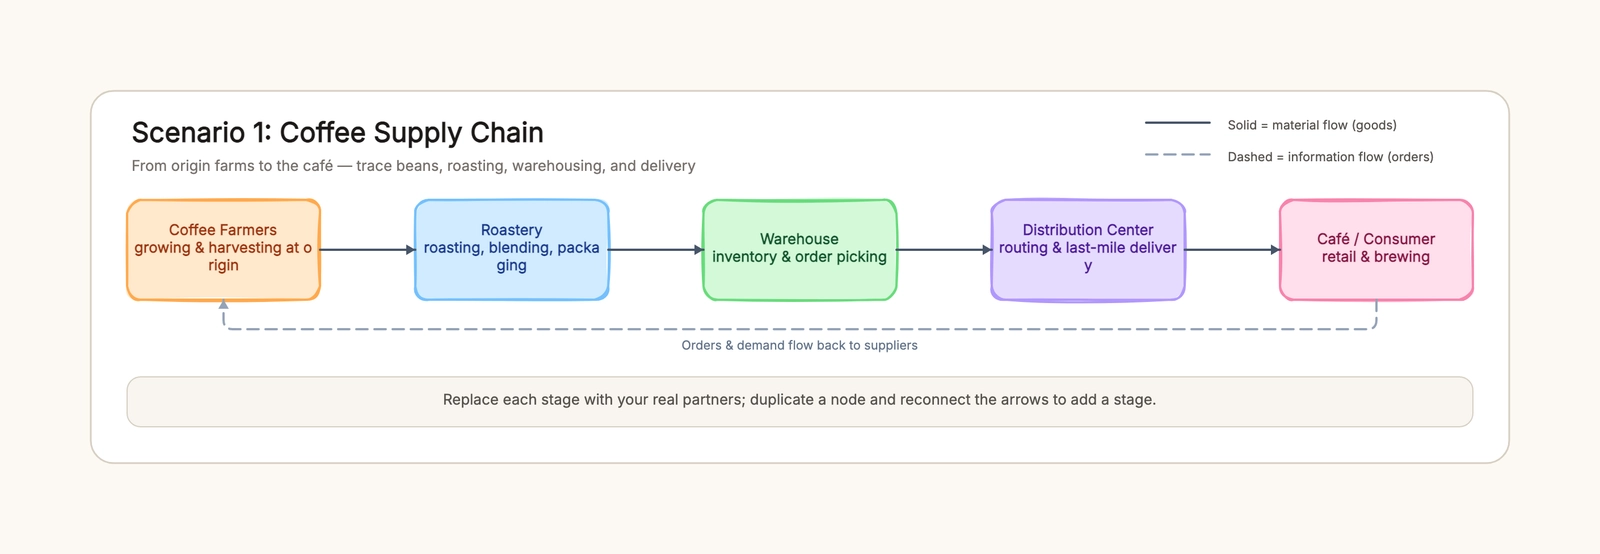
A coffee supply chain starts at the origin and ends at the cup. The entities run: coffee farmers (growing and harvesting), roastery (roasting, blending, packaging), warehouse (inventory and order picking), distribution center (routing and last-mile delivery), and café or consumer (retail and brewing).
The material flow carries green beans from the farmers to the roastery, roasted beans to the warehouse, finished product to distribution, and delivered goods to the café. The information flow runs the other way: a café's orders and a roaster's demand signals travel back to the farmers, telling them what to grow and how much to harvest.
What makes coffee worth diagramming is traceability. A batch that can be traced from farm to roast to cup is worth more, and the diagram is where that traceability lives. Label the origin and the roast batch on each handoff, and the chain doubles as a traceability record.
Automotive supply chain example
An automotive supply chain is multi-tier, and that is the key difference from coffee. The entities run: tier suppliers (steel, chips, wiring harnesses), assembly plant (stamping, welding, final assembly), regional warehouse (vehicle and parts inventory), dealer network (transport and handover), and driver or fleet (purchase and after-sales).
The material flow is obvious — parts in, vehicles out — but the value is in keeping each tier separate. A car company does not have one supplier; it has Tier 1 suppliers who assemble modules, Tier 2 suppliers who make components, and Tier 3 suppliers who make raw material. Collapsing them into one "supplier" box hides the lead time and the single points of failure that actually cause production stops. The information flow carries forecasts and replenishment signals back up through every tier.
Pharmaceutical supply chain example
A pharmaceutical supply chain adds two constraints the other examples do not have: temperature and regulation. The entities run: API suppliers (active ingredients and excipients), manufacturer (formulation, filling, quality control), cold-chain warehouse (temperature-controlled storage), distributor (cold-chain delivery and replenishment), and hospital or pharmacy (prescribing and dispensing).
In this diagram you mark the cold-chain legs explicitly. A vaccine or biologic that leaves its temperature range is not "slightly off" — it is unsafe to use, so the cold-chain warehouse and distributor are called out rather than implied. Quality-control and compliance checkpoints sit on the forward flow, and prescriptions and demand ride the return flow. The diagram becomes a compliance tool as much as a logistics one.
For a broader process view that pairs well with this, the value stream map template focuses on time and waste, and the SIPOC diagram template frames suppliers, inputs, process, outputs, and customers at a high level.
Common supply chain diagram mistakes
Only drawing the forward flow
A chain with only right-pointing arrows hides how demand reaches suppliers. Without the dashed return line, the diagram tells half the story — the supplier produces, but no one knows why or how much.
One box for several entities
Collapsing supplier, warehouse, and distributor into one "logistics" box erases the handoffs and the accountability that live at those boundaries. Keep each real party its own node.
Mixing material and information into one line
Goods and demand travel in opposite directions. If both ride the same line, the reader cannot tell which way anything flows. Solid for material, dashed for information, always with a legend.
No role or ownership on a stage
A node that says only "warehouse" tells the reader nothing about what happens there. Add the role — inventory, picking, cold-chain, assembly — so every stage states what it does.
Unlabeled handoffs
What moves between a roastery and a warehouse is not self-evident. Label each handoff with the actual goods, so the flow is concrete instead of generic.
Keep the diagram useful over time
A supply chain diagram is a living document, not a one-time drawing. When you add a supplier or move a warehouse, update the diagram in the same week. Keep the legend and the flow labels consistent, and share the current version with procurement, operations, and anyone who needs to explain who feeds whom.
Start with the supply chain diagram template, replace the coffee, automotive, or pharmaceutical entities with your own, and draw both flows. When you need to map a single internal procedure instead of a multi-party chain, the process map template is the right tool for that job.