Community asset mapping is a way to see everything a neighborhood can already bring to a problem — the skills people have, the groups they belong to, the places they share, and the relationships between them — instead of starting from what is missing. This article shows you how to build that map in seven steps, then walks through a complete food-access example so you can see what a finished map looks like in practice.
By the end, you will have a repeatable structure you can copy into a mind map template and run as a group exercise in a single evening.
What Is Community Asset Mapping?
Community asset mapping is a method for identifying and visualizing the strengths a community already holds, then arranging them so people can see how those strengths connect. It grew out of Asset-Based Community Development, an approach popularized in the 1990s by John McKnight and Jody Kretzmann at Northwestern University. The core idea is a deliberate reversal of how community work is usually framed: instead of starting with a list of problems and deficits, you start with what residents can already do and what already works.
The difference is not just optimistic framing. A needs assessment asks "what is wrong and what do we lack?" — which tends to point toward outside funding and outside experts. An asset map asks "what do we have that we are not fully using?" — which points toward actions residents can take themselves. Both have a place, but the asset map is what turns a group of neighbors into a group that can move on its own.
A completed asset map is not a report. It is a picture of capacity: who knows whom, what space is underused, which skills are hiding in plain sight. The map earns its keep when a specific question — how do we get more families to fresh food, how do we support isolated older residents — makes those connections suddenly actionable.
What Counts as a Community Asset?
The most common failure in asset mapping is listing only institutions and forgetting everything else. A complete map draws from six categories, and each one needs a concrete, named example.
Individual skills. What residents already know how to do — cooking, translating, fixing bikes, bookkeeping, teaching. A person who can run a community meal, or translate flyers into a second language, is as real an asset as any building.
Resident associations and informal groups. Neighbor WhatsApp groups, a running club, a parents' network, a block's informal watch group. These are not registered organizations, but they are how information and favors actually travel.
Institutions. Schools, libraries, clinics, places of worship, community centers. The trick is to list what each offers beyond its official function — a school has a kitchen, a library has meeting rooms, a clinic has staff who know the neighborhood.
Physical spaces. Vacant lots, a community garden, a school hall that sits empty on weekends, a parking lot that could host a market. Space is often the asset people notice last because it is not attached to a name.
Local economic resources. Corner shops, co-ops, local employers, a café that already lets groups meet for free. Money is not the point; the point is that local businesses have goods, jobs, and goodwill that stay in the neighborhood.
Relationships and culture. Trust between long-time residents, a festival everyone attends, informal mutual-aid habits like checking on an elderly neighbor. This is the category that holds the other five together, and it is the one most maps skip.
For each asset you list, write not just a name but a sentence on what it can offer to the specific question you are trying to answer.
Community Asset Mapping in 7 Steps
The steps below are ordered so the map produces action, not just a pretty wall chart.
1. Define the boundary and the question. Decide the area — one block, one neighborhood, one school catchment — and, more importantly, the question the map has to answer. "What do we have?" is too vague. "What do we have that could get more families to fresh food?" is concrete enough to filter the list.
2. Invite residents to participate. The map should be built by the people who live there, not handed to them by an outside consultant. Hold a session in a familiar place, at a time people already gather, and make it easy to contribute without public speaking.
3. Gather assets. Give everyone sticky notes or a shared board and ask them to name people, groups, places, and resources they know. Do not filter or judge yet — the goal is volume and variety.
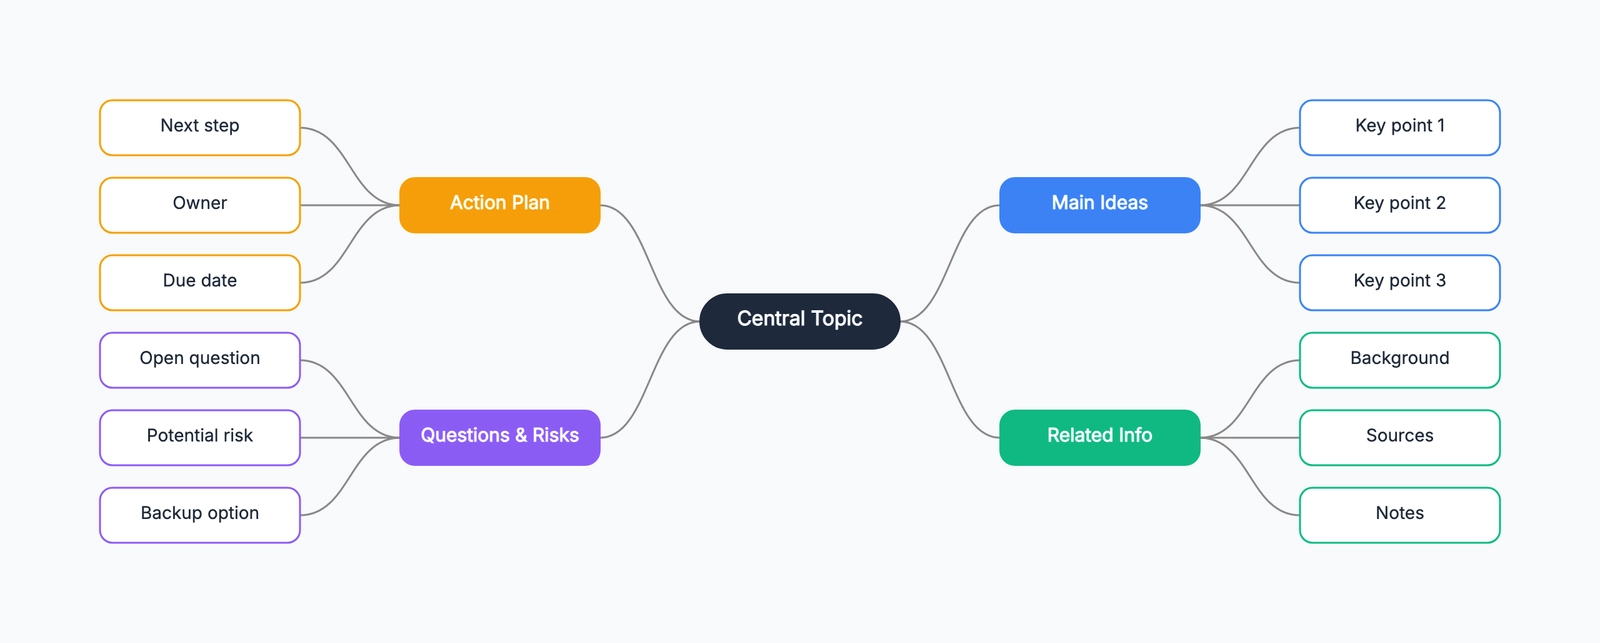
4. Group assets by category. Cluster what you collected into the six categories above. This is where a mind map template helps: one central question, six category branches, and named assets branching off each.
5. Draw the relationships. Draw lines between assets that already work together or could. The person who can cook connects to the school kitchen; the school kitchen connects to the café that donates surplus. These lines are where the map stops being a list and starts being a plan.
6. Identify gaps and combinations. Notice what is missing — not to lament it, but to ask which existing assets could cover it. A gap in transport might be covered by a resident with a van and a volunteer who coordinates. A gap in space might be covered by a hall that only opens on weekends.
7. Assign next steps and owners. For each promising combination, write one concrete action and one person who owns it. "Marisol will ask the café about surplus bread on Tuesday" is an action. "Improve food access" is a wish. Only the first moves anything.
Community Asset Mapping Example: Food Access
Here is the process applied to a realistic scenario: a neighborhood where fresh, affordable food is hard to reach for many families.
The question. "What do we already have that could get more families to fresh, affordable food within the next three months?"
What residents listed. During a two-hour session, residents and a few local staff put up these assets, grouped into categories:
- Skills: a resident who runs a home-cooking class, a bilingual resident who translates flyers, two volunteers who already coordinate a weekend soup kitchen.
- Groups: a parents' WhatsApp group of 80 households, a youth club that meets on Fridays, a faith group that organizes monthly community dinners.
- Institutions: a primary school with a commercial kitchen, a library with a meeting room, a clinic whose staff know which families are food-insecure.
- Spaces: a school kitchen idle after 3 p.m., a church hall free on Saturday mornings, a covered area outside the library.
- Local economy: a bakery that throws away unsold bread each night, a corner shop willing to stock a small produce box, a minibus owner who does school runs.
- Relationships and culture: the parents' group already shares surplus food informally, and the faith group's dinners are trusted by families who avoid formal services.
The connections that emerged. When the group drew lines between these assets, three combinations stood out:
- The bakery's surplus bread + the school kitchen's cold storage + the two volunteers' coordination = a weekly bread-and-produce pickup, rather than bread going to waste.
- The bilingual resident + the clinic's knowledge of food-insecure families + the parents' group's reach = flyers and sign-ups that actually reach the families who need the pickup, without stigma.
- The minibus owner + the church hall on Saturdays = a way to bring older residents who cannot walk to the market, not just food to them.
The actions. The session ended with owners and dates: the soup-kitchen volunteers would ask the bakery for a pickup day that week; the bilingual resident would draft a flyer with the clinic; the parents' group would run the sign-up. Each action used assets that already existed — nothing on the list required new funding or an outside agency.
The map format. For this exercise the group used a category-first mind map — it was the fastest way to collect and cluster. If the priority had been who influences the food system, they would have switched to a stakeholder map instead. If the priority had been turning resources into measurable outcomes for a grant, a nonprofit logic model would fit better.
Choose the Right Map Format
Not every asset map looks the same. Pick the format by the question you are answering.
Mind map (by category). Branch from one central question into the six asset categories, then into named assets. Best for collecting and clustering quickly, and for starting a group discussion. This is the fastest format to start in, and the mind map template gives you the structure ready-made.
Geographic map (by place). Pin assets onto a real street layout to see what is physically close to what. Best when distance matters — where residents live versus where food, transport, or services actually are. Note that this needs map software for accurate positioning; CodePic is a whiteboard for drawing relationships, not a GIS tool.
Network map (by relationship). Draw assets as nodes and the connections between them as lines, so you can see who already works with whom and where the missing links are. Best when you are trying to strengthen coordination between organizations rather than inventory resources.
Most groups start with a mind map to collect everything, then redraw as a network map if coordination is the real problem.
Community Asset Map vs. Stakeholder Map vs. Logic Model
These three tools are easy to confuse because they all show up in community and nonprofit work. They answer different questions.
An asset map answers "what do we already have?" It inventories skills, groups, places, and relationships so a community can act on its own strengths. See the stakeholder mapping example for how a related but different tool works.
A stakeholder map answers "who has influence and how should we engage them?" It plots people by power and interest to plan communication and win support. Use it when the question is about people and politics, not resources. The stakeholder map template shows the classic influence-interest grid.
A logic model answers "how do our resources turn into activities, results, and impact?" It lays out a program's causal chain in columns — inputs, activities, outputs, outcomes, impact. Use it when you are planning or justifying a funded program. The nonprofit logic model examples walk through three complete programs.
In practice they are sequenced: map assets to see what you have, map stakeholders to see who can move it, then build a logic model when you need to turn the work into a fundable, measurable program.
Common Mistakes
Listing only institutions. A map of schools, clinics, and agencies misses the residents, groups, and relationships that actually make things happen. Fix it by explicitly asking for all six categories, not just the official-sounding ones.
Ignoring residents' skills. People are the most underused asset in most neighborhoods, but skills are invisible unless you ask. Fix it by asking "what do you know how to do?" early and recording the answers, even the ones that seem small.
Having an outside team do it for them. A consultant-built map sits on a shelf because no resident feels ownership of it. Fix it by having residents gather and group the assets themselves, with outside help limited to facilitation.
Treating gaps as assets. "No grocery store within walking distance" is a gap, not an asset. Keep gaps in a separate column and pair each one with an existing asset that could partly cover it.
Finishing with no action. A map with no owners and no dates is a poster. Fix it by ending every session with named actions, owners, and a check-in date — even two or three actions are enough to make the map real.
How to Keep the Map Useful
A community asset map decays fast — people move, businesses close, groups dissolve. To keep it useful:
Set an owner. One person (ideally a resident, not an outside staff member) is responsible for the map staying current. Rotate the role if needed, but never leave it unnamed.
Schedule updates. Revisit the map before each major project, after a new organization opens or closes, and whenever a key contact changes. A quarterly pass to verify the most-used assets is usually enough.
Verify, don't assume. Every few months, check that the phone numbers, contacts, and spaces still exist. A map full of dead contacts is worse than no map, because people act on it and get burned.
Review after each project. When a project ends, look back at the map and ask what changed — which assets got stronger, which connection turned out to be weak, what should be added. That review is what keeps the map from becoming a one-off exercise.
A community asset map is only as good as the action it produces. Start from what people already have, gather it in six categories, draw the connections, and end with owners and dates. Open the mind map template and run the seven steps with your own group — the food-access example above is a pattern you can swap out for any question your neighborhood is trying to answer.
Related Guides
- Stakeholder Mapping Example — plot influence and interest when the question is about people, not resources.
- Nonprofit Logic Model Examples — turn resources into measurable outcomes when you are planning a funded program.
- Stakeholder Map Template — the influence-interest grid for engagement planning.
- Nonprofit Logic Model Template — the five-column framework for program planning.