Developers have a different relationship with diagrams than most people who draw them. A diagram that lives in a slide deck is dead on arrival. A diagram that lives in the repo, renders in the README, diffs cleanly in pull requests, and regenerates from source — that's a diagram worth maintaining.
The tools that serve developers well tend to share a few qualities: plain-text formats that work with git, CLI or CI/CD integration, and enough diagram depth to cover the architectures and flows engineers actually need to document. Here's a developer-focused comparison of the tools that get this right.
What Makes a Diagramming Tool "Developer-Friendly"
Before comparing tools, some criteria that matter more to developers than to the general diagramming audience:
Code-first workflow. The diagram source is text — Markdown, DSL, or a structured format — that you edit in your editor, not a canvas you click on. This means you can copy-paste, find-and-replace, and reuse patterns without a mouse.
Version control. The source diffs cleanly in git. You can review diagram changes in a PR the same way you review code changes, and merge conflicts are resolvable.
CI/CD integration. You can generate images or SVGs from diagram source as part of your build pipeline, so docs stay in sync with the codebase automatically.
Editor integration. The tool works where you already write code — VS Code, JetBrains, Neovim — without switching to a browser tab.
Recommended Stack by Team Maturity
The phrase best diagramming tools for developers sounds like it should produce one winner, but developer teams usually need a stack.
For a solo project or early startup, start with Mermaid for README diagrams and CodePic or Excalidraw for fast architecture thinking. That gives you one durable text format and one canvas for messy exploration.
For a growing engineering team, add draw.io for diagrams that need cloud icons, network shapes, or polished technical deliverables. Keep Mermaid for small diagrams inside ADRs and PRs, but do not force every diagram into syntax when visual placement matters.
For a platform or enterprise team, consider Structurizr for C4 architecture views and PlantUML for formal UML. At that stage, governance matters: diagrams need ownership, review rules, and a place in the docs pipeline. The right stack is the one your team will actually update after the launch meeting.
1. Mermaid
Type: Text-to-diagram (JavaScript) GitHub/GitLab support: Native markdown rendering Diagram types: Flowcharts, sequence, ERD, Gantt, class, state, pie, git graph, mind maps, timeline
Mermaid is the default choice for developers who want diagrams in markdown. GitHub, GitLab, Notion, and Obsidian all render Mermaid natively — write a ````mermaid` block in your README and it becomes a diagram. No rendering step, no image export, no external service.
The syntax is JavaScript-inspired and relatively intuitive for common diagram types. A flowchart looks like A[Start] --> B{Decision} --> C[End]. Sequence diagrams use Alice->>Bob: Hello. It's easy to read even without rendering.
Limitations: Mermaid's layout engine can produce awkward results on complex diagrams, especially with many nodes. The diagram type coverage is good but not exhaustive — no network topology, no deployment diagrams, no C4 model support. For basic-to-intermediate developer documentation, it's excellent. For formal architecture documentation with strict layout requirements, it can be frustrating.
Best for: README diagrams, architecture decision records (ADRs), any diagram that needs to render directly in GitHub or GitLab markdown.
2. PlantUML
Type: Text-to-diagram (Java) GitHub/GitLab support: Via plugins or build step Diagram types: All 14 UML types, plus wireframes, mind maps, Gantt, JSON/YAML data visualization
PlantUML is the heavyweight of text-based diagramming. It covers every UML diagram type — class, sequence, component, deployment, use case, activity, state, timing, and more — plus non-UML types like wireframes, mind maps, and Gantt charts. If there's a formal diagram notation, PlantUML probably supports it.
The syntax is more verbose than Mermaid but more expressive. You can control colors, styles, layouts, and stereotypes in detail. The rendering is typically done server-side (plantuml.com's public server or a self-hosted instance) or locally with Java and Graphviz.
The friction is setup. PlantUML requires a renderer — either a local Java installation, a Docker container, or a server endpoint. VS Code and JetBrains plugins handle this automatically, but CI/CD integration needs an explicit rendering step. For teams that already have Java in their stack, this is trivial. For a pure Node.js or Python team, it adds a dependency.
Best for: Teams that need comprehensive UML coverage in a text-based, version-controllable format, especially in Java/enterprise contexts.
3. D2
Type: Text-to-diagram (Go) GitHub/GitLab support: Via image export Diagram types: Flowcharts, sequence, ERD, class, grid, network, and more
D2 is the newest major text-to-diagram tool, and it solves the biggest pain point of Mermaid and PlantUML: automatic layout. D2's layout engine (powered by its own constraint-based algorithm) consistently produces better-looking diagrams with less manual positioning than either Mermaid or PlantUML.
The syntax is clean and Go-inspired — readable even without documentation. A sequence diagram in D2 looks like declarative configuration rather than code, which makes it approachable for teams where not everyone writes code daily.
D2 is newer, so the ecosystem is smaller. Fewer editor plugins, fewer CI/CD integrations, and no native GitHub markdown rendering. You render to SVG or PNG via the D2 CLI and check in the output images. The diagram type coverage is narrower than PlantUML but covers the most common developer needs well.
Best for: Teams that want the best automatic layout in a text-based tool and are comfortable with a younger ecosystem.
Test the Stack with One System Design
Use the system design below as a representative repository artifact. Recreate it in the tools you are considering, change one service in a branch, and review both the source diff and rendered output.
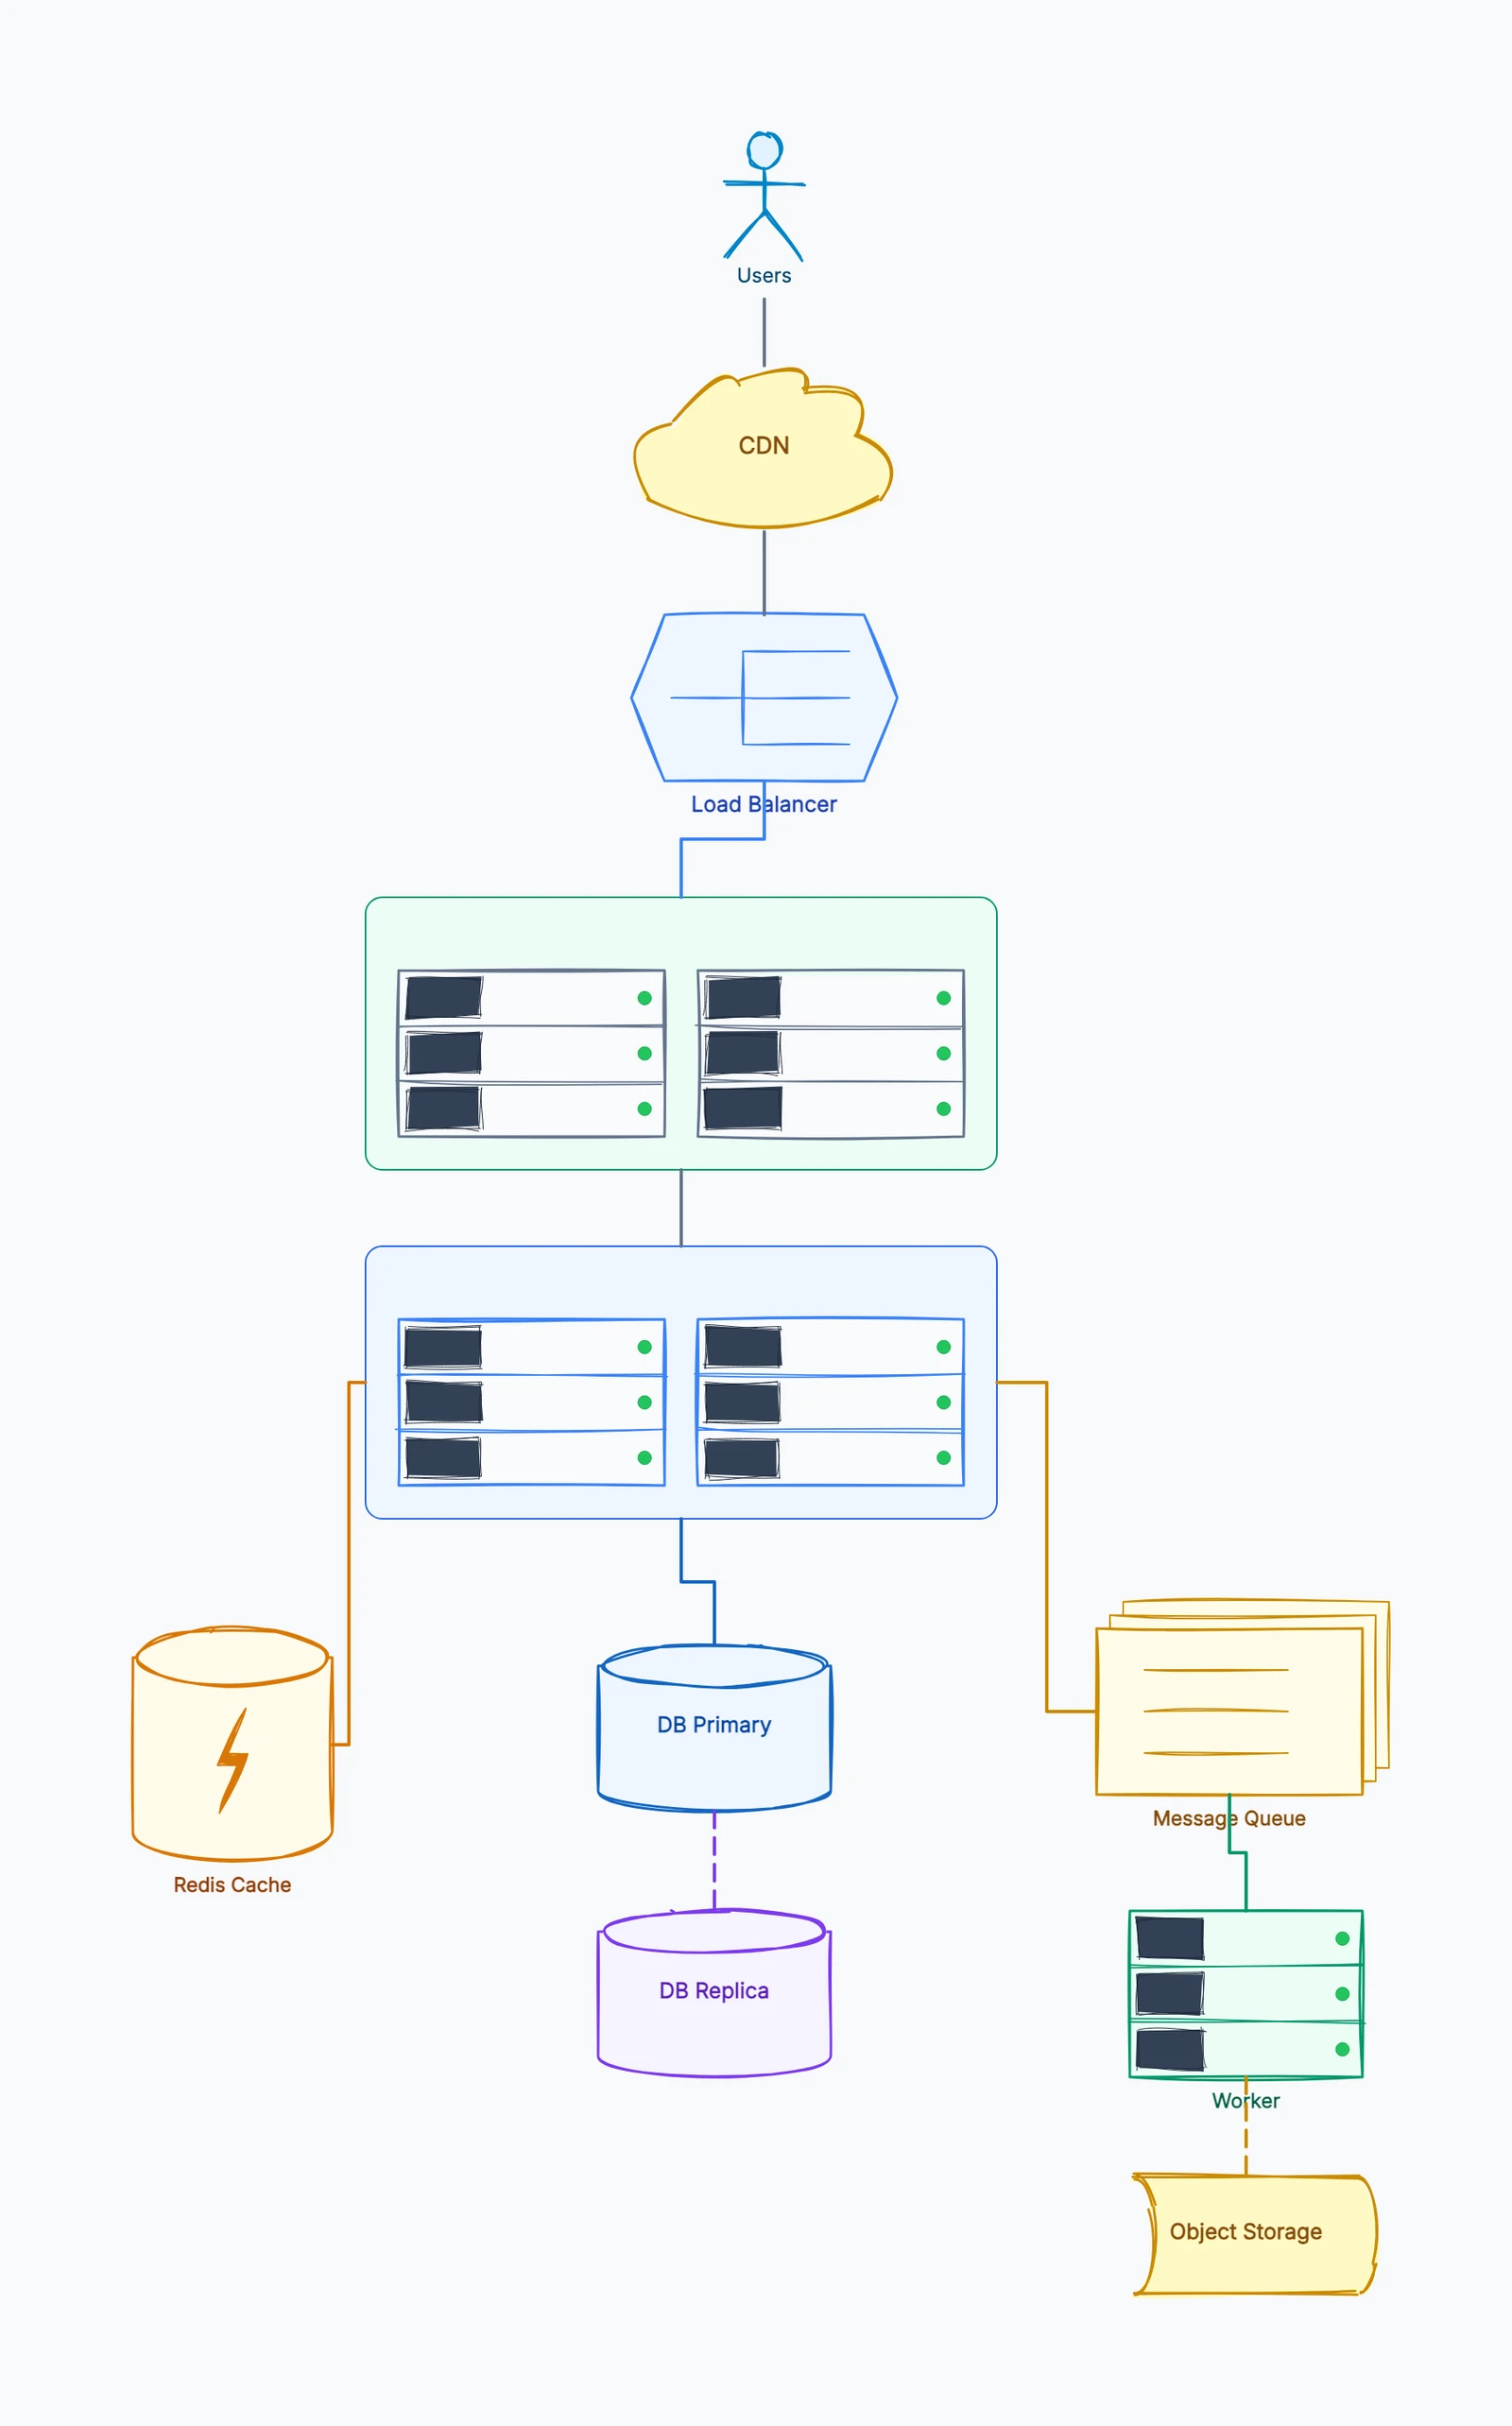
System design
Try this templateThe best developer tool is the one that keeps that edit understandable in code review without making the published diagram harder to read.
4. draw.io
Type: WYSIWYG + text export GitHub/GitLab support: Via VS Code extension or file export Diagram types: Comprehensive — UML, network, BPMN, ERD, cloud architecture, and more
draw.io (also at diagrams.net) isn't code-first, but it earns its place on this list for two reasons. First, its file format is editable XML — you can diff .drawio files in git (messy, but possible) and the VS Code extension lets you edit them without leaving the editor. Second, the shape library depth is unmatched for technical documentation — AWS, GCP, Azure, Kubernetes, Cisco network icons, and deep UML coverage that no text-based tool matches for visual precision.
Many developer teams use draw.io for formal architecture diagrams that need precise icon placement, and Mermaid for quick inline diagrams in READMEs and ADRs. The combination covers most documentation needs.
Best for: Formal cloud architecture diagrams and technical documentation that need icon-accurate visuals, especially when combined with Mermaid for inline docs.
5. CodePic
Type: WYSIWYG + AI (MCP) GitHub/GitLab support: Via MCP integration with Claude/Cursor Diagram types: Flowcharts, sequence, ERD, org charts, mind maps, wireframes, swimlanes, system architecture
CodePic takes a different approach from the text-based tools above. It's a hand-drawn-style infinite whiteboard, but its developer-facing feature is MCP (Model Context Protocol) integration. If you're already working in Claude or Cursor, you can describe a diagram in plain language — "draw a sequence diagram of an OAuth 2.0 authorization code flow" — and it places editable shapes on the canvas.
This isn't code-as-diagram in the Mermaid sense, but it's a different developer workflow that some teams find more natural: think about the system, describe it in words, and iterate on the result visually rather than in syntax. The diagrams export to PNG and SVG.
The trade-off is that the source isn't text — there's no .mmd or .puml file to version-control. If diagram-as-code in git is non-negotiable, stick with Mermaid or PlantUML. If rapid iteration from natural language is more valuable, CodePic fills a gap the text-based tools don't address.
Best for: Developers already working with Claude or Cursor who want AI-assisted diagramming without learning diagram syntax, especially for early-stage architecture sketching.
6. Structurizr DSL
Type: Architecture-as-code (Java/DSL) GitHub/GitLab support: Native (text format) Diagram types: C4 model (Context, Container, Component, Code)
Structurizr is purpose-built for the C4 model — a hierarchical approach to software architecture diagrams created by Simon Brown. You describe your system in a Java-based DSL: users, software systems, containers, components, and their relationships. Structurizr renders the diagrams automatically and keeps multiple views of the same model consistent.
This is the most principled approach to architecture diagrams for developers. A single model generates multiple views, so changing a relationship in one place updates every diagram. The DSL is version-controllable, and the tool has CI/CD integrations for automated rendering.
The scope is intentionally narrow — C4 model only, no flowcharts, no sequence diagrams, no ERDs. It's the best tool for C4 architecture documentation, but it's not a general-purpose diagramming tool.
Best for: Teams that have adopted the C4 model for architecture documentation and want model-driven, always-consistent diagrams.
7. Graphviz
Type: Text-to-diagram (C) GitHub/GitLab support: Via build step Diagram types: Directed and undirected graphs, network diagrams, dependency maps
Graphviz is the oldest tool on this list and still one of the best for automatically laying out large graphs. You describe nodes and edges in DOT language, and Graphviz computes the layout using battle-tested algorithms (hierarchical, force-directed, radial, circular).
It's not for hand-crafting pretty diagrams. It's for situations where you have a large graph — 50+ nodes, hundreds of edges — and manual layout isn't practical. Dependency maps, network topologies, call graphs, and state machines with many transitions are where Graphviz shines.
The output is SVG or PNG. Integration is via CLI in a build step. Editor plugins exist but are basic. Graphviz is a Unix-philosophy tool: it does one thing (graph layout) extremely well and expects you to pipe its output into your documentation pipeline.
Best for: Large, automatically-generated graphs where manual layout isn't feasible — dependency maps, call graphs, complex state machines.
Quick Comparison
| Tool | Code-First | Git Diffable | Diagram Depth | Best For |
|---|---|---|---|---|
| Mermaid | ✓ | ✓ (clean) | Good | README, ADRs, inline docs |
| PlantUML | ✓ | ✓ (clean) | Excellent (UML) | Full UML in git |
| D2 | ✓ | ✓ (clean) | Good | Best auto-layout |
| draw.io | Partial (XML) | Messy | Excellent | Cloud architecture |
| CodePic | AI-driven | No (visual) | Good | AI-assisted sketching |
| Structurizr | ✓ (DSL) | ✓ (clean) | Narrow (C4) | C4 model docs |
| Graphviz | ✓ (DOT) | ✓ (clean) | Narrow (graphs) | Large auto-layout graphs |
How to Choose
Developer diagramming tools fall into three categories, and most teams use at least one from each:
Text-in-repo diagrams (Mermaid, PlantUML, D2): For diagrams that need to live alongside code, render in READMEs, and survive PR review. Start with Mermaid — it's the most widely supported. Graduate to PlantUML if you need UML depth, or D2 if layout quality is the bottleneck.
Precision visual diagrams (draw.io): For formal architecture docs, cloud infrastructure diagrams, and anything that needs icon-accurate visuals. Export to SVG and check into the repo alongside the .drawio source.
AI-assisted and rapid sketching (CodePic, Excalidraw): For early-stage architecture thinking, whiteboard sessions that become documentation, and diagrams generated from natural language descriptions in your AI workflow.
The honest take: the tool that gets updated is infinitely better than the perfect tool that doesn't. Pick tools that fit into your existing workflow — editor, CI/CD, code review — rather than tools that demand a new workflow.
Related Reading
- Mermaid vs draw.io (2026): Diagram-as-Code or Visual Editor? — Detailed comparison of the two approaches.
- Mermaid vs Lucidchart (2026) — Free diagram-as-code vs paid visual platform.
- Mermaid vs PlantUML: Which Diagram-as-Code Tool Fits Your Workflow? — Head-to-head of the two leading text-based tools.
- draw.io vs Lucidchart (2026): Pricing, Features & Which to Pick — When your needs extend beyond diagram-as-code.
- Best Free Online Whiteboard Tools in 2026 — Broader free whiteboard roundup.