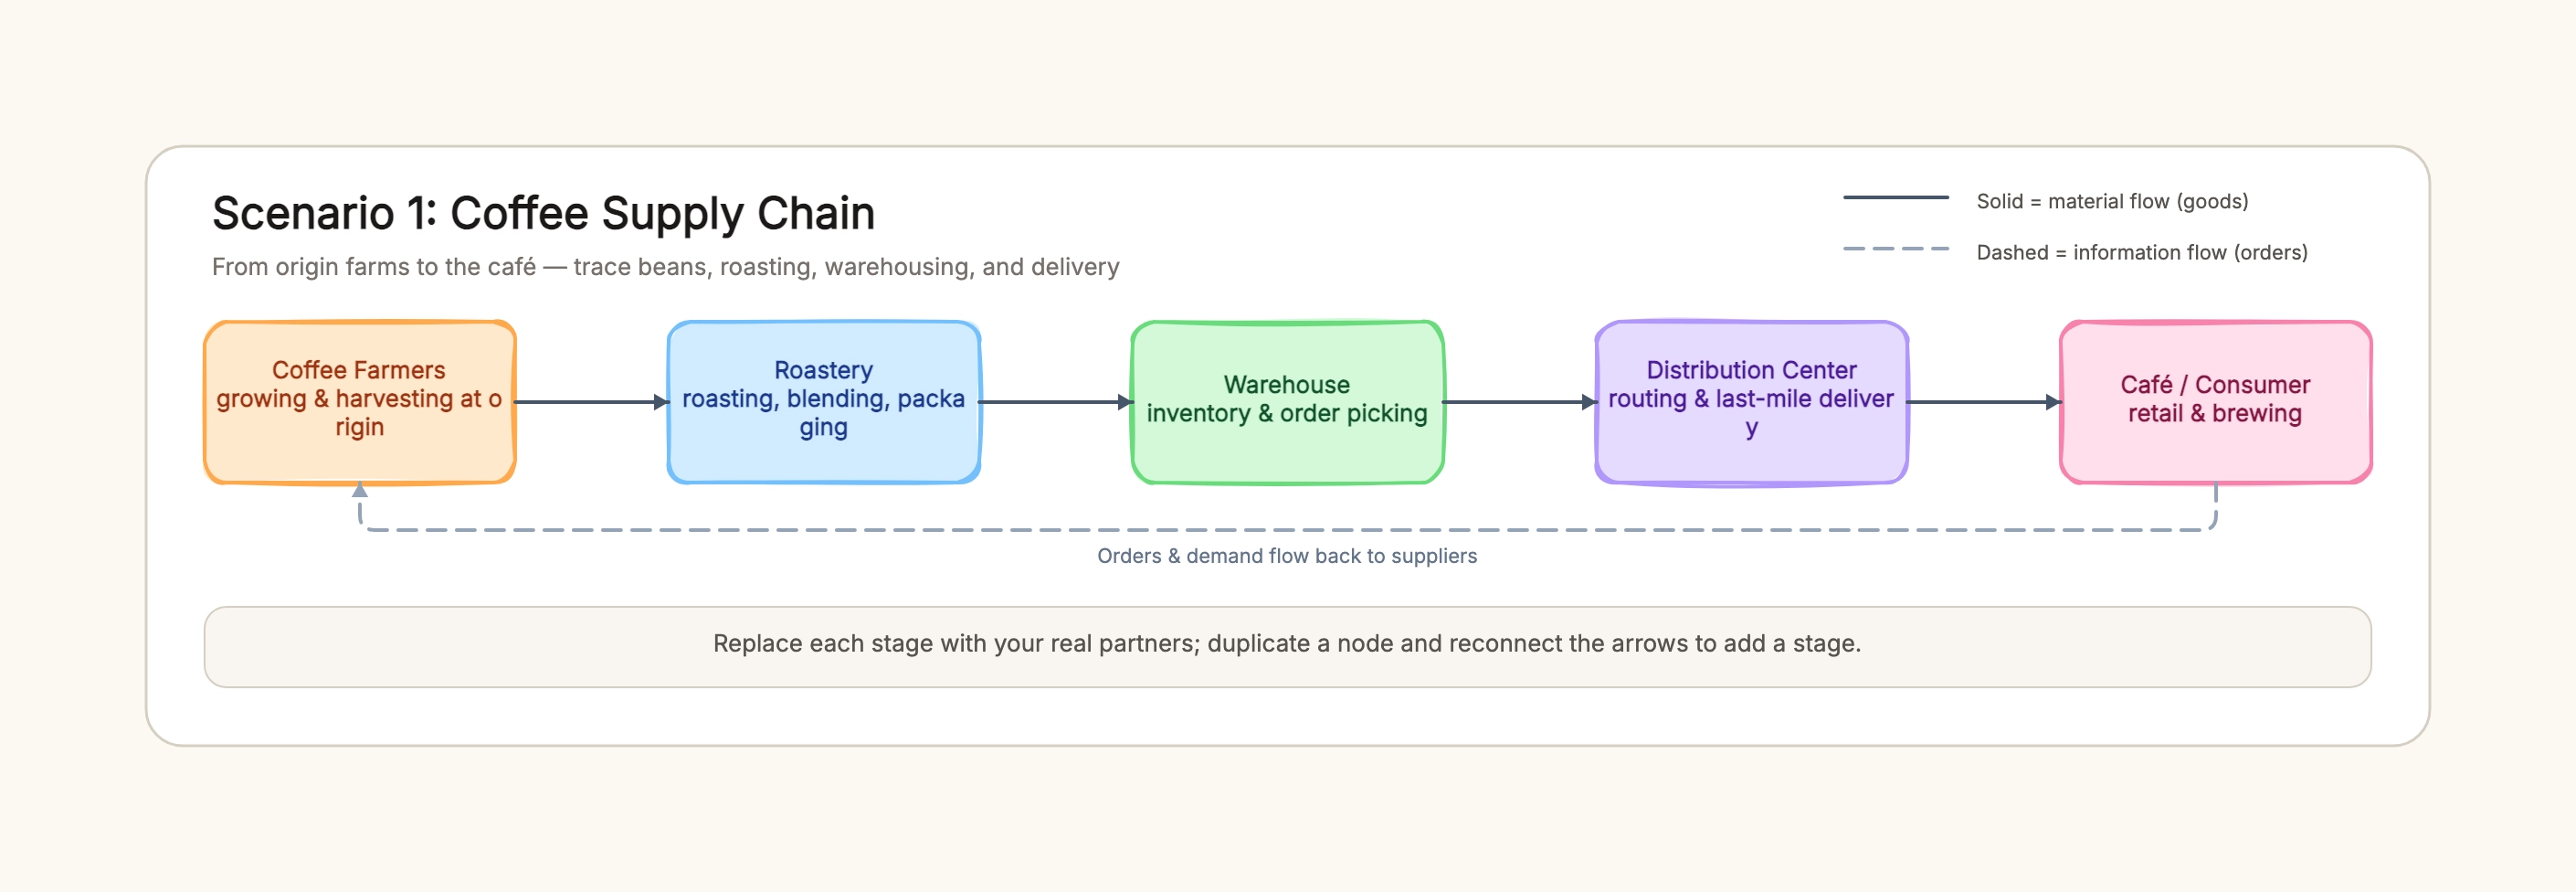
Coffee supply chain
Who uses it: A coffee roaster or café operator mapping bean-to-cup traceability
Coffee Farmers → Roastery → Warehouse → Distribution Center → Café
Forward: green beans, roasted beans, finished product
Return: orders and demand signals
Traceability tags at origin and roast batch
Why this works: Coffee chains benefit from traceability, so the diagram keeps each handoff labeled with what moves and when the batch changes hands.
Automotive supply chain
Who uses it: A procurement or supply chain manager at an OEM or tier supplier
Tier 1 / 2 / 3 Suppliers → Assembly Plant → Regional Warehouse → Dealer → Driver
Forward: steel, chips, harnesses, finished vehicles
Return: forecast and replenishment signals
Lead-time and sourcing notes per tier
Why this works: Automotive chains are multi-tier, so each supplier level stays a separate node to keep sourcing, lead time, and risk visible.
Pharmaceutical supply chain
Who uses it: A quality or logistics lead in pharma manufacturing or distribution
API Suppliers → Manufacturer → Cold-Chain Warehouse → Distributor → Hospital / Pharmacy
Forward: ingredients, finished medicine
Return: prescriptions and demand
Cold-chain and regulatory checkpoints marked
Why this works: Pharma chains carry temperature and compliance constraints, so cold-chain legs and quality checkpoints are called out rather than implied.
Retail grocery supply chain
Who uses it: A retail operations manager mapping farm-to-shelf flow
Growers & Packers → Distribution Center → Store → Shopper
Forward: produce and packaged goods
Return: sales and replenishment data
Shelf-life and seasonal notes
Why this works: Grocery chains compress the middle stages and emphasize freshness, so shelf-life and replenishment data ride the return flow.
E-commerce fulfillment chain
Who uses it: An operations manager at an online seller or 3PL
Suppliers → Fulfillment Center → Last-Mile Carrier → Customer
Forward: inventory and parcels
Return: orders, tracking, and returns
Returns looped back to the warehouse
Why this works: E-commerce chains add a returns loop, so the diagram shows the reverse physical flow of returns alongside the information flow.
Electronics manufacturing chain
Who uses it: A supply chain or NPI lead in consumer electronics
Component Suppliers → Contract Manufacturer → Regional Hub → Retailer → Consumer
Forward: components and finished devices
Return: demand forecast and RMA data
Component-obsolescence and lead-time flags
Why this works: Electronics chains juggle many components and short lifecycles, so component risk and RMA data are tracked on the return flow.