A project timeline template for Google Sheets gives you the same structured chart-building approach as Excel, with one thing Excel can't match: real-time collaboration without version control headaches. Multiple team members update milestone dates in the same sheet, the chart refreshes for everyone instantly, and nobody has to email around "timeline_v3_final_FINAL.xlsx."
This guide walks through building a collaborative project timeline in Google Sheets, from data table to presentable chart, plus sharing and embedding tips.
Fastest Visual Option: Use Sheets for Collaboration, CodePic for the Final Timeline
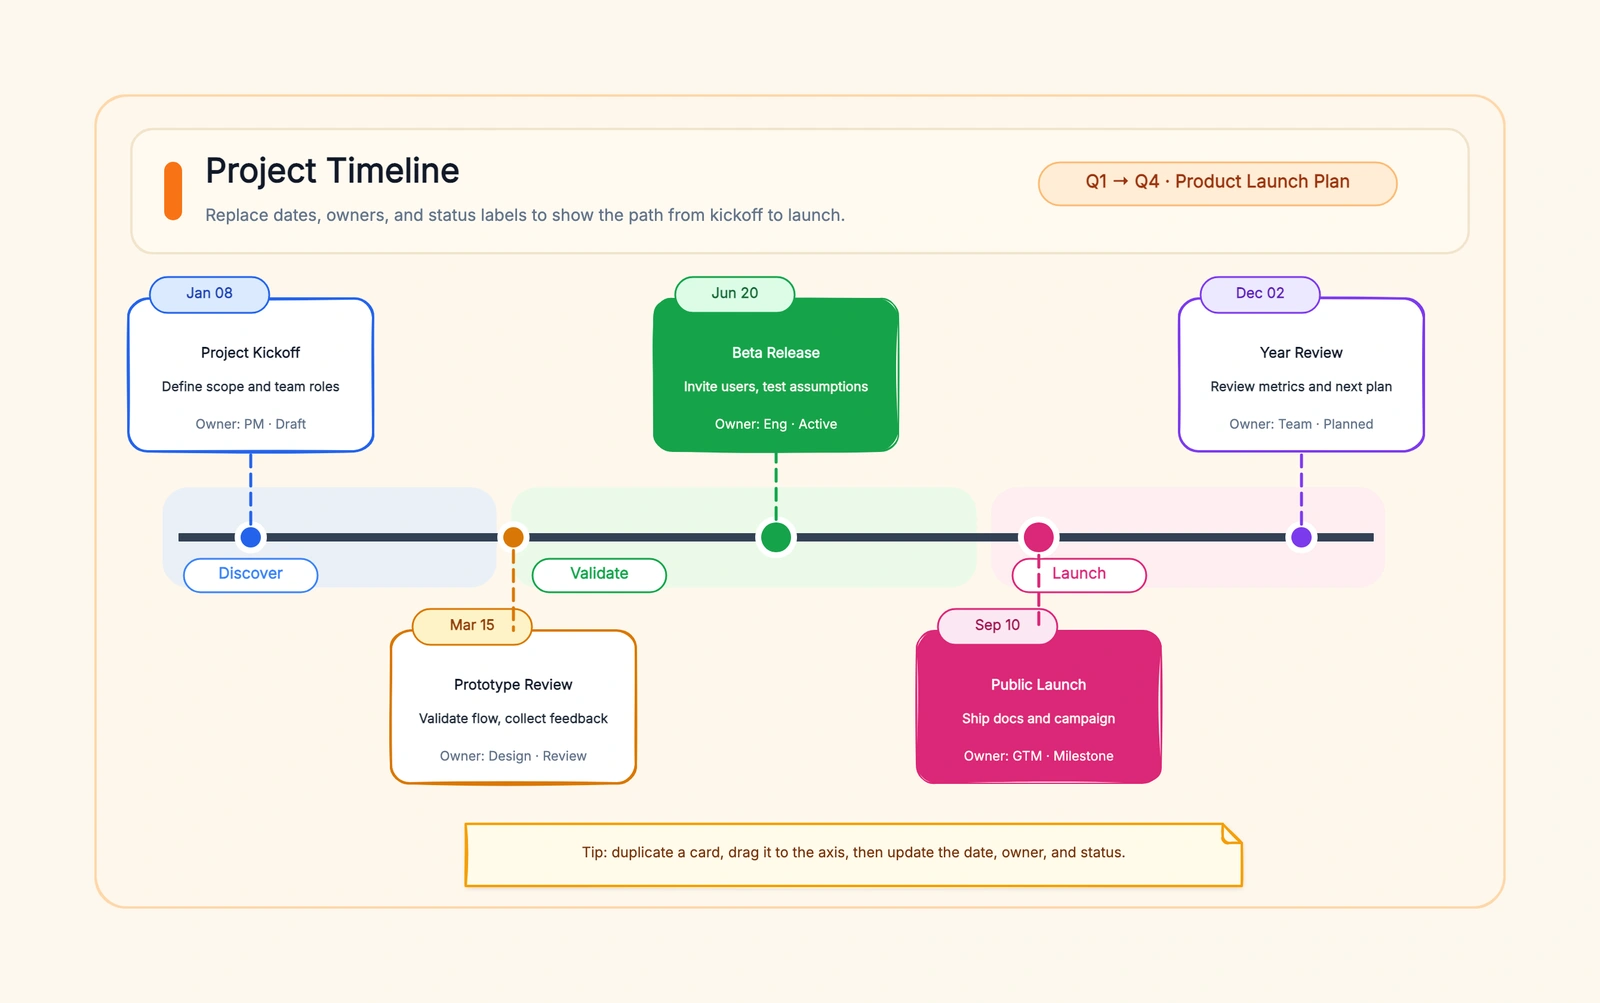
Google Sheets is excellent while dates are still changing. Once the plan is stable, the chart often needs a visual pass before it goes into a client update, board memo, or launch deck. Open the CodePic timeline template, copy over the approved milestones, and export a polished PNG without rebuilding the spreadsheet.
That split keeps the workflow honest: Sheets handles collaborative editing and version history; CodePic handles the readable visual that people can understand at a glance.
Why Google Sheets for Project Timelines
Three advantages over Excel:
Real-time collaboration. A PM updates the launch date, engineering sees the timeline shift immediately, and the stakeholder viewing the embedded chart in Google Slides gets the update without touching anything. No file versions, no "who has the latest?", no merge conflicts.
Native Google Workspace integration. A timeline built in Sheets embeds directly into Google Docs (for project plans) and Google Slides (for presentations). The embedded chart stays linked — update the sheet, the doc and deck update too. This alone saves the "export PNG → reimport → notice a typo → do it again" loop.
Free and universally accessible. Anyone with a Google account (free) can edit. Anyone with the link can view. No software to install, no license to buy.
The trade-off: Google Sheets chart formatting options are less extensive than Excel's. You can't customize every pixel of a chart the way you can in Excel. For most project timelines, the default formatting options are enough; for a timeline going into a board presentation, build it in a dedicated tool and import the image.
Step-by-Step: Build a Timeline in Google Sheets
Step 1: Set Up Your Data
Same structure as Excel — three columns: Milestone, Date, and Plot Order.
| A: Milestone | B: Date | C: Plot Order |
|---|---|---|
| Kickoff | 2026-01-15 | 1 |
| Design review | 2026-02-20 | 2 |
| Dev complete | 2026-04-10 | 3 |
| Testing | 2026-05-01 | 4 |
| Launch | 2026-06-01 | 5 |
Format column B as Date (select column → Format → Number → Date). Column C uses sequential numbers to control vertical positioning.
Step 2: Insert the Chart
Select columns A and B. Go to Insert → Chart. Google Sheets usually defaults to a bar chart — if not, change Chart type to "Stacked bar chart" in the Chart Editor panel on the right.
Step 3: Configure the Chart
In the Chart Editor:
- Setup tab: Set Data range to your milestone and date columns. Under Series, click "Add series" and select column C (Plot Order) if you want vertical positioning control.
- Customize tab: Under "Vertical axis," check "Reverse axis order" so the earliest milestone appears at the top. Under "Horizontal axis," set the Min and Max to your project date range. Under "Series," reduce bar thickness by adjusting the gap width.
Step 4: Clean Up and Style
Remove the legend (Chart Editor → Customize → Legend → None). Lighten or remove gridlines. Add data labels showing milestone names (Customize → Series → Data labels). Use one bar colour for all milestones, with a single accent colour for the most important one.
Step 5: Share and Embed
Click the chart → three-dot menu → Publish chart. Choose between "Interactive" (viewers can hover for details) and "Image" (static PNG). Copy the link or embed code. For Google Docs/Slides: Insert → Chart → From Sheets → select your timeline chart.
Worked Example: A Software Launch Timeline
Suppose a product team needs one timeline for a six-month launch. The working plan has six milestones: kickoff, requirements approval, design review, development complete, beta release, and public launch. Each milestone has one accountable owner and one date. That is enough structure for a timeline; task details and dependencies can stay in the project tracker.
Start by entering the milestones in chronological order. Use real dates in the Date column, not text such as “mid-April,” so Sheets can place every point on a continuous axis. Keep the label outcome-based: “Requirements approved” is more useful than “Requirements meeting,” because a reader can tell what changed at that point.
Next, build the chart and check the spacing. The gap from design review to development complete is intentionally larger than the gap from beta to launch. A true date axis makes that difference visible. If every milestone appears evenly spaced, the chart is probably using categories rather than dates; return to the chart setup and confirm that the Date column is the horizontal axis.
Use the Phase, Status, and Owner columns for planning without crowding the chart. During weekly review, the product manager changes Beta release from May 1 to May 12 and marks it Blocked. The visual shifts automatically, while the status cell and comment preserve why the date moved. Stakeholders reading the linked Google Slides chart see the revised schedule after the presenter clicks Update.
Before sharing, apply three checks:
- Confirm that every date uses the same year and date format.
- Make sure each milestone names an observable result rather than an activity.
- View the chart at the size it will occupy in the document or slide.
The finished Google Sheets project timeline answers three questions at a glance: what happens, when it happens, and who owns it. If the team also needs task duration, dependencies, or critical path, do not keep adding fields to this milestone chart. Move that operational detail to a Gantt view and keep the timeline as the concise stakeholder summary.
Copyable Google Sheets Project Timeline Template
Start with this structure instead of an empty sheet. Paste the table into cell A1, then replace the sample values with your project data:
| Milestone | Date | Phase | Status | Owner |
|---|---|---|---|---|
| Kickoff | 2026-01-15 | Discovery | Complete | Project lead |
| Requirements approved | 2026-02-05 | Discovery | Complete | Product |
| Design review | 2026-02-26 | Design | In progress | Design |
| Development complete | 2026-04-10 | Build | Not started | Engineering |
| Beta release | 2026-05-01 | Validate | Not started | Product |
| Public launch | 2026-06-01 | Launch | Not started | Marketing |
Use Milestone + Date as the chart source. Keep Phase, Status, and Owner in the sheet as operational context; they do not all need to appear on the visual. Add data validation to Status so every row uses the same values: Not started, In progress, Blocked, or Complete. Conditional formatting can flag Blocked rows in red without changing the timeline itself.
If your project tracks durations rather than milestone dates, add Start and End columns and build a stacked bar chart instead. At that point the sheet is becoming a lightweight Gantt chart. The simple project timeline template is better for milestone-only communication, while the free Gantt chart maker comparison covers tools built for overlapping work and dependencies.
Troubleshooting the chart
- Dates appear as numbers: format the source cells as Date before editing the horizontal axis.
- Milestones appear backward: reverse the vertical axis order.
- The first or last milestone is clipped: set horizontal-axis minimum and maximum a few days outside the project range.
- Labels overlap: shorten milestone names first; only then reduce font size or switch to a larger chart.
- The embedded chart is stale: click Update in Docs or Slides after the source sheet changes.
Collaboration Tips
Protect the chart structure. Team members updating milestone dates shouldn't accidentally modify the chart configuration. Use Data → Protected sheets and ranges to lock the chart source data range so only the milestone date cells are editable.
Use comments for milestone context. Right-click a milestone cell → Comment to add context ("Client requested Q3 instead of Q2 — waiting on final confirmation"). Comments keep the timeline itself clean while preserving decision history.
Set up notifications. Tools → Notification settings → choose "Any changes are made" to get email alerts when someone updates a milestone. Good for PMs who need to know immediately when a date shifts.
Google Sheets vs Other Timeline Tools
| Google Sheets | Excel | Dedicated Tool (Canva/CodePic) | |
|---|---|---|---|
| Collaboration | Real-time, free | Via OneDrive/SharePoint | Depends on tool |
| Chart quality | Functional | More customizable | Usually best |
| Embedding | Native in Google Workspace | Native in Office | PNG import |
| Learning curve | Low (if you know Sheets) | Low (if you know Excel) | Varies |
| Best for | Collaborative planning | Solo, data-heavy | Presentation-ready output |
If collaboration is the bottleneck on your project timelines, Google Sheets is the right call. If visual polish is the bottleneck, build in a dedicated tool after the data is settled.
For a timeline that skips the chart setup entirely, open the CodePic timeline template — browser-based, hand-drawn style, no signup needed. Edit your milestones and export to PNG in under 5 minutes.
Related Reading
- Free Project Timeline Maker: 7 Tools + Templates Compared — The main timeline pillar with full tool comparisons
- Project Timeline Template Excel: Free Download + Step-by-Step — When the timeline data is already in a spreadsheet
- Project Timeline Template PowerPoint: Beyond SmartArt — When the final destination is a slide deck
- Simple Project Timeline Template: Clean, Fast, No Fuss — When collaboration isn't the bottleneck and you just need it done