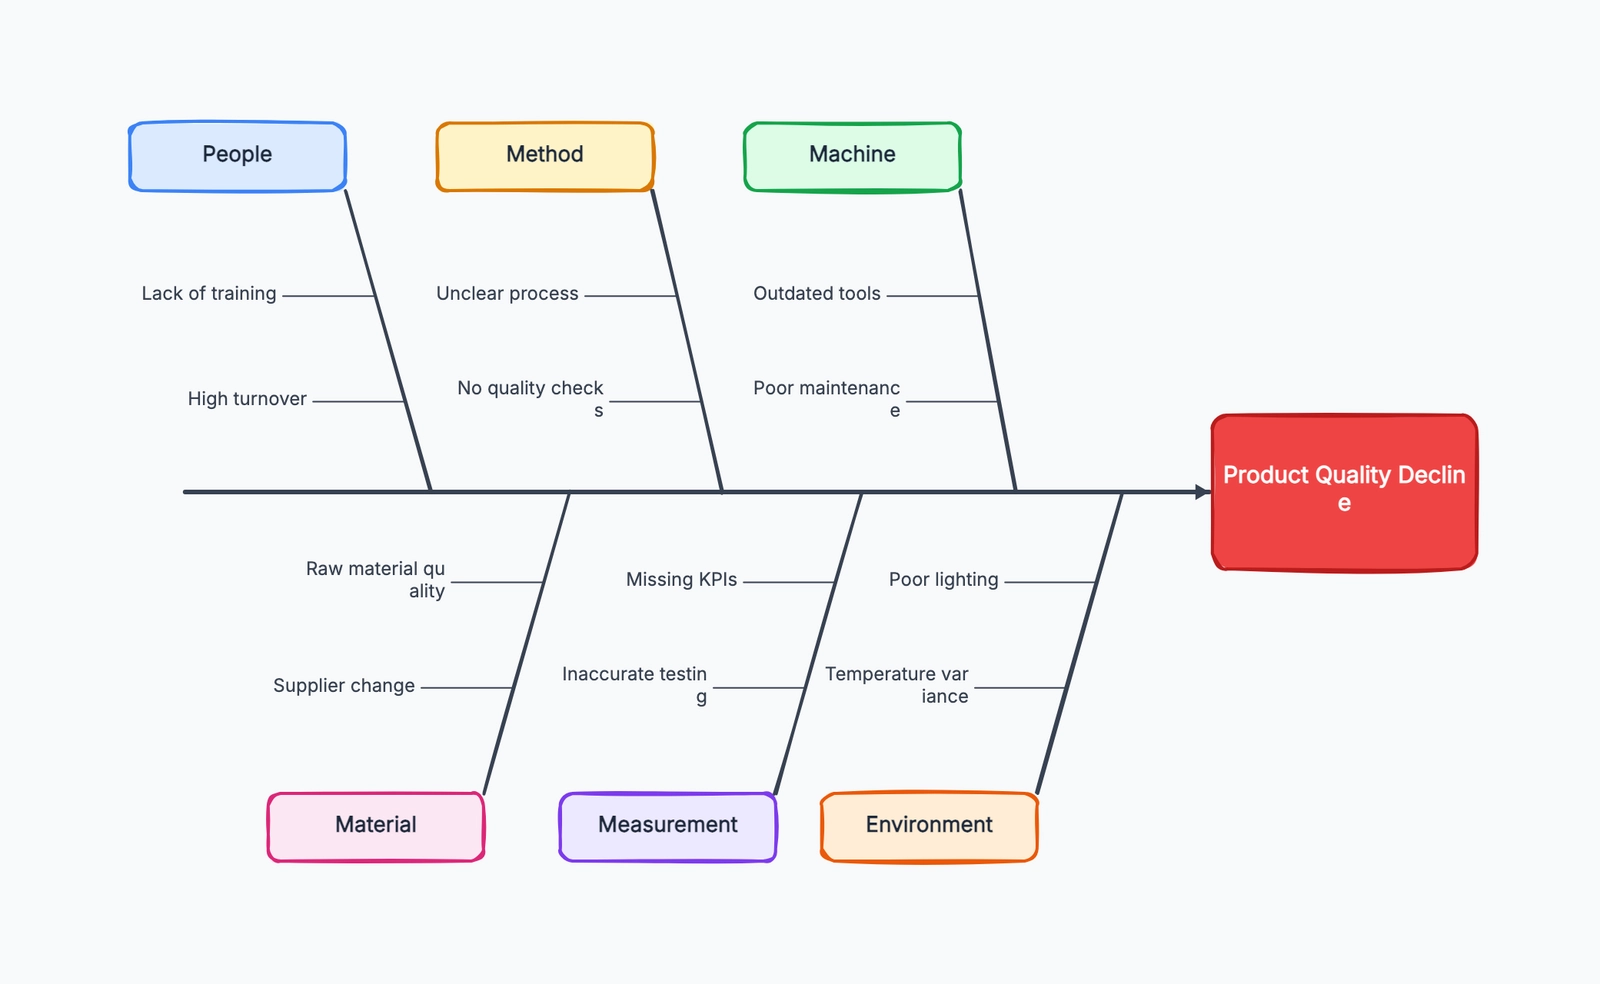
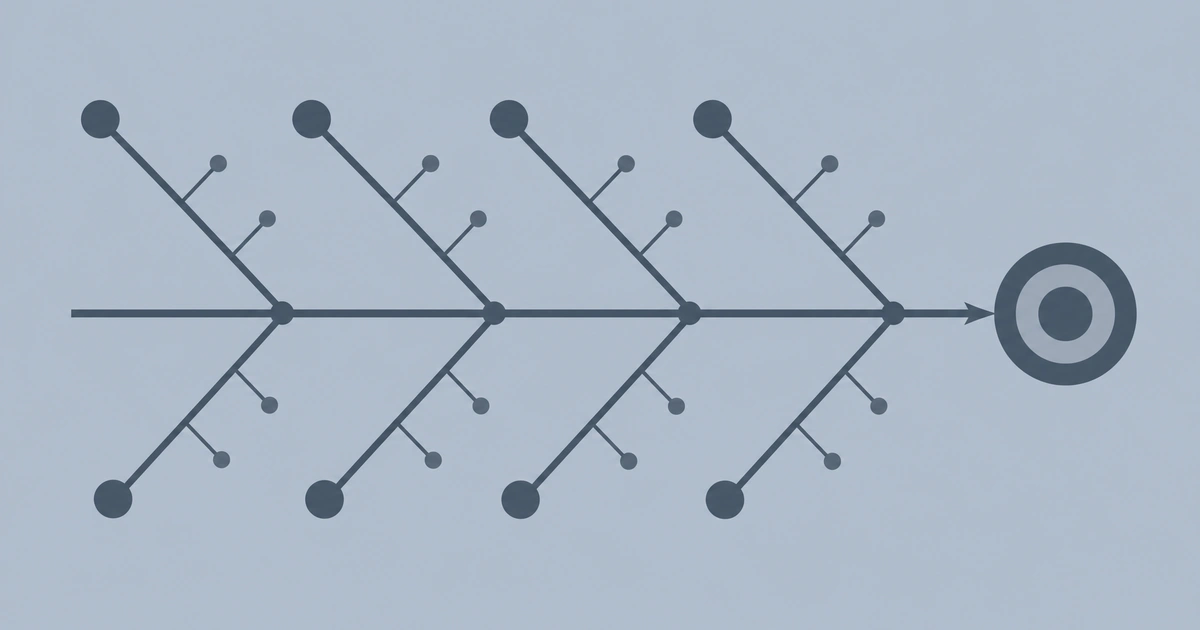
A fishbone diagram template turns a messy problem — "why are customers complaining?" — into an organized, visual investigation. The name comes from the shape: a horizontal spine with diagonal bones branching off, each bone representing a category of potential causes. At the head sits the problem statement. The bones hold the causes. Together, they show every factor that might contribute to the problem, organized in a way that makes patterns visible.
The fishbone diagram was developed by Kaoru Ishikawa in the 1960s for quality management at Kawasaki shipyards. It has since spread to every industry because the core idea is universal: most problems have multiple causes, and those causes cluster into categories. Finding the real root cause means looking at all the categories, not just the most obvious one.
Open the free fishbone diagram template to start with a pre-built structure. The rest of this guide explains the standard cause categories, how to customize them for your context, and how to run a fishbone session that produces actionable findings.
When to Use a Fishbone Diagram
Use a fishbone diagram when the problem is clear but the causes are not. If you already know the root cause — a server crashed because the disk was full — you do not need a fishbone. If the problem is "customer satisfaction dropped 12 points this quarter and we are not sure why," a fishbone helps organize the investigation.
The fishbone is ideal for:
- Quality problems: defects, returns, complaints, service failures where multiple factors could be at play
- Process breakdowns: delays, bottlenecks, or errors where the cause could be in people, tools, or procedures
- Team retrospectives: after a project goes wrong, use a fishbone to map contributing factors across categories
- Risk assessment: before starting a project, brainstorm what could go wrong and map the risks onto a fishbone
- Continuous improvement: as part of a Kaizen or Lean initiative to identify waste and inefficiency sources
The Six Standard Cause Categories
The original Ishikawa categories come from manufacturing. If they do not fit your context, rename them — the structure matters more than the labels.
People: Anyone involved in the process. Causes might include insufficient training, unclear roles, staffing shortages, or communication gaps.
Process: The steps, procedures, and workflows. Causes might include missing steps, inconsistent execution, outdated documentation, or approval bottlenecks.
Equipment: Tools, machines, software, and infrastructure. Causes might include outdated versions, lack of maintenance, compatibility issues, or capacity limits.
Materials: Inputs, data, components, or resources the process consumes. Causes might include poor quality inputs, late deliveries, incorrect specifications, or insufficient quantity.
Environment: Physical or organizational conditions. Causes might include workspace layout, noise levels, company culture, regulatory changes, or market conditions.
Measurement: How you track and evaluate. Causes might include inaccurate metrics, missing KPIs, inconsistent measurement methods, or feedback loops that are too slow.
For a software team, you might rename these to: Code, Infrastructure, Process, Dependencies, Team, and Monitoring. The labels change; the principle stays the same — causes cluster into categories, and looking at all categories prevents tunnel vision.
A Complete Fishbone Diagram Example
The free fishbone template comes pre-filled with a customer complaint example:
Problem (head): Customer complaint rate increased 40% in Q3.
People branch: insufficient training on new product features, understaffed during peak hours, no clear escalation path for complex issues
Process branch: no standard response template for common issues, ticket routing based on availability rather than expertise, follow-up step optional rather than required
Equipment branch: CRM lag during peak load, knowledge base search returns irrelevant results, chat tool drops connection on mobile
Materials branch: outdated FAQ content, product documentation not synced with latest release, missing troubleshooting guides for new features
Environment branch: open office noise affecting phone support quality, remote agents working across time zones with handoff gaps
Measurement branch: CSAT survey sent 48 hours after resolution when users have moved on, no tracking of first-contact resolution rate, SLA measured on response time but not resolution quality
This example shows the power of the format: a manager might look at the complaint spike and assume "we need more agents" (People), but the fishbone reveals that equipment, process, and measurement issues are just as significant. Hiring without fixing the CRM lag and the outdated FAQ will not solve the problem.
How to Customize Categories for Your Context
The six standard categories are a starting point, not a constraint. Here are category sets for common domains:
Software / DevOps: Code, Infrastructure, Dependencies, Process, Team, Monitoring Marketing: Channels, Content, Audience, Timing, Budget, Competition Customer Service: People, Policy, Procedure, Technology, Information, Environment Healthcare: Staff, Procedure, Equipment, Supplies, Environment, Communication Education: Student, Teacher, Curriculum, Resources, Environment, Assessment
To choose categories: think about the last three similar problems your team faced. What kinds of causes came up? Group them into 4–6 categories. Write the categories as labels on the fishbone bones.
How to Run a Fishbone Session
- Write the problem statement at the head of the fish. Be specific — "Delivery delays" is less useful than "Average delivery time increased from 2.3 to 4.1 days in June."
- Label the bones with your cause categories. Use the standard six or customize them for your domain.
- Brainstorm causes within each category. Use sticky notes or directly type into the template. Encourage quantity over quality at this stage — you will filter later.
- Dig deeper with sub-branches. For each cause, ask "why does this happen?" and add a sub-branch. Repeat until you reach actionable causes.
- Identify the most likely root causes. Circle or highlight the causes that appear in multiple categories or that, if fixed, would eliminate several downstream causes.
- Define countermeasures. For each top root cause, write a concrete action, an owner, and a deadline.
Fishbone Diagram vs. Excel, Word, and PowerPoint
You can draw a fishbone diagram in Excel or PowerPoint by manually placing lines and text boxes. The result is usually a static image that is hard to edit and share. An online editable fishbone template lets you click to edit text, drag branches to reorganize, and share a live link — no attachment ping-pong.
Free, Editable, and Downloadable Fishbone Templates
Search results for fishbone diagram template often mix several different intents: people want a free template, an editable template, a Word template, a PowerPoint slide, an Excel file, or a printable worksheet. These are related, but they are not the same need.
Use an editable online template when the team is still investigating causes. Root cause analysis changes as people talk. Someone adds a process issue, another person realizes it belongs under measurement, and a third person splits one broad cause into three sub-causes. A static Word or PowerPoint file makes that iteration slow because every edit requires manual alignment.
Use a Word or PowerPoint fishbone template when the analysis is already done and you need to place the final diagram into a report or deck. In that case, the template is presentation output, not the working space. The practical workflow is:
- brainstorm and organize causes in an editable diagram
- agree on the most likely root causes
- export the finished fishbone as an image
- place the image into the report, slide, or incident review document
Use Excel only if the team thinks in tables first. Excel can capture cause categories and notes, but it is not good at showing the visual "bones" of the analysis. If the goal is pattern recognition in a meeting, the diagram view is stronger.
How to Keep the Fishbone Readable
A fishbone diagram can become unreadable quickly because every branch invites more sub-branches. The template should help you organize thinking, not reward adding every possible cause.
Keep the diagram readable with a few rules:
- Limit the main bones to 4–6 categories.
- Put short phrases on branches, not full sentences.
- Use sub-branches only for causes that need one more level of detail.
- Avoid crossing branches; move items instead of forcing lines through text.
- Highlight the top 2–3 likely root causes after the brainstorm.
The final fishbone should tell a reviewer where to look first. If every cause has the same visual weight, the session produced a list but not a decision. After brainstorming, use color, circles, or a short note to mark which causes the team will investigate or fix.
For remote teams, readability matters even more because people will open the diagram after the meeting without the facilitator's explanation. Use category names that match the team's language, keep each cause close to its branch, and leave enough whitespace between bones. If a cause needs a long explanation, put the short label on the diagram and capture the supporting detail in the meeting notes. The diagram should remain a map, not a transcript.
It is also worth separating "possible cause" from "confirmed cause." During brainstorming, the fishbone should welcome possibilities. During follow-up, the team should verify the most likely causes with data, observation, interviews, logs, or process review. A simple visual convention helps: leave brainstormed causes as regular text, then add a check mark, color highlight, or small note beside causes that have been validated. That keeps the final template useful for decision-making instead of becoming a memory of every idea mentioned in the room.
Start with the Free Fishbone Diagram Template
The fishbone diagram template organizes scattered causes into a structure that reveals patterns. Open the free template, replace the pre-filled example with your own problem, and find the causes that matter most.