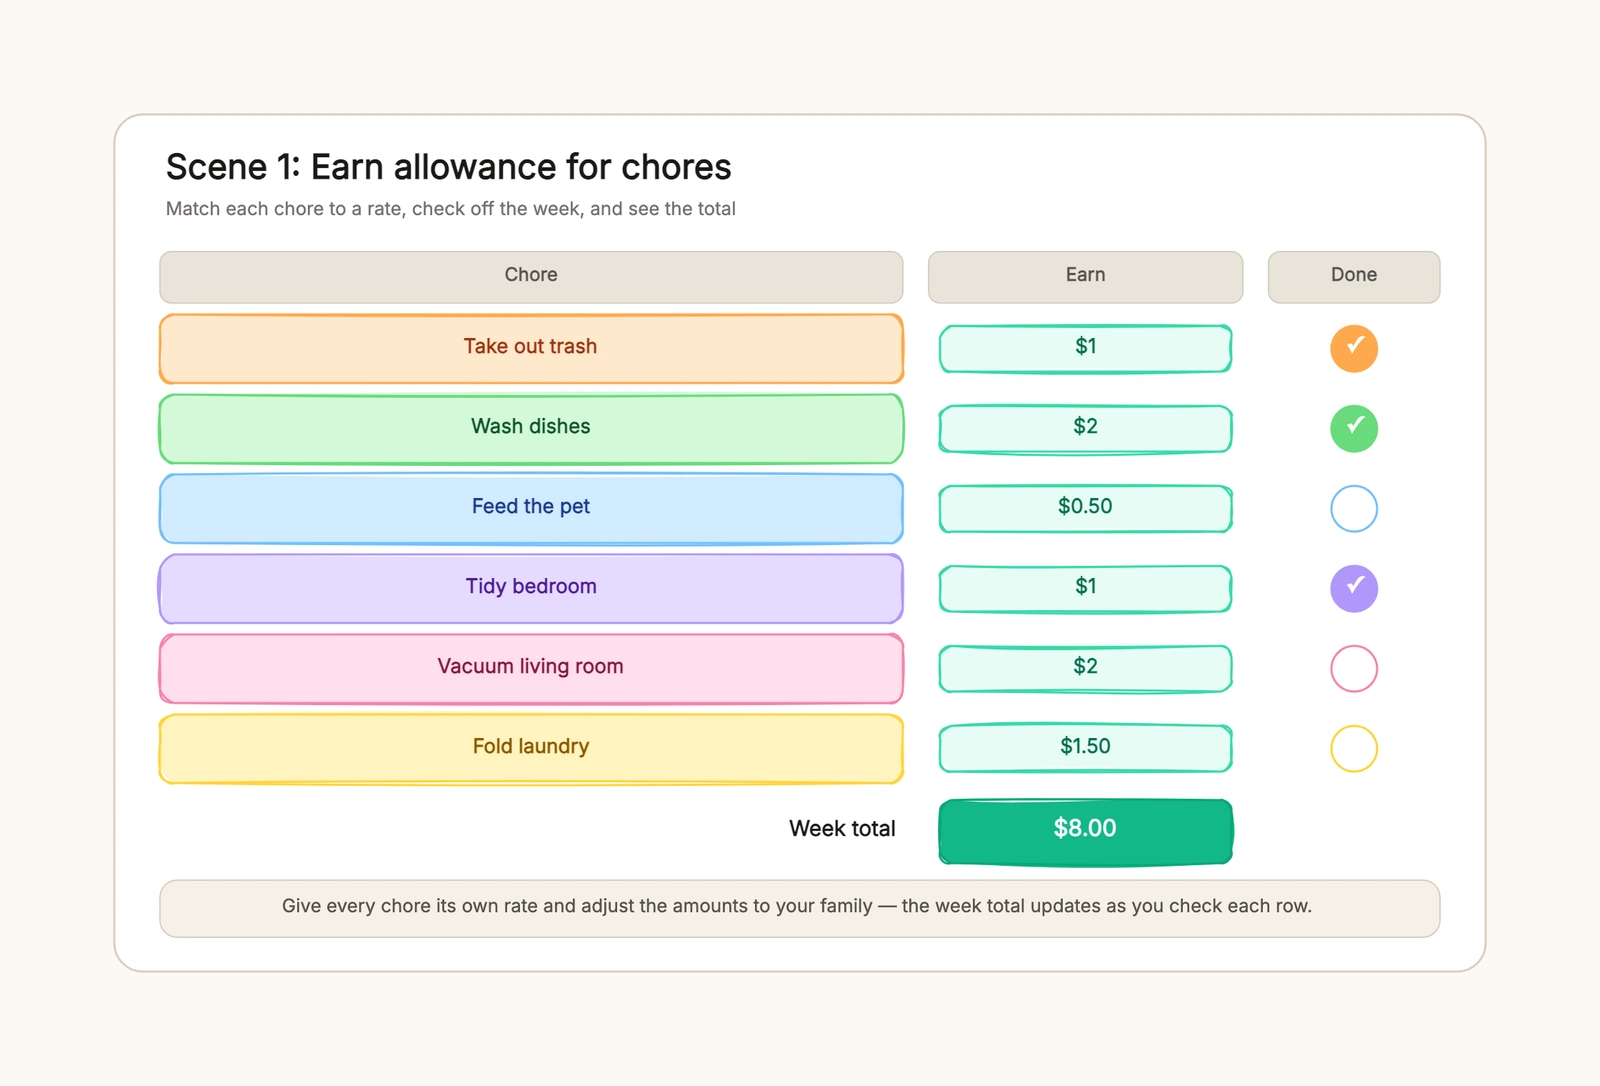
An allowance chart is the difference between paying your child for chores and teaching them what money actually does. It turns "how much did I earn this week?" into a table where every chore has a rate, every row has a check, and the total adds up at the bottom. The whole point is the chore-to-money match: take out trash earns $1, wash dishes earns $2, and the amount sits right next to the chore so the link is impossible to miss.
This guide walks through how to build an allowance chart for kids, then shows the three shapes it takes — earn-by-chore, a weekly fixed allowance, and a save-spend-donate split. You can adapt the allowance chart template and edit the rates, chores, and jars directly in the browser.
What an allowance chart should do
An allowance chart is not the same as a chore chart. A chore chart tracks who does what; an allowance chart adds money to the equation. That one addition changes what the child learns: instead of just checking tasks off, they connect work to pay.
A useful allowance chart answers four questions at a glance:
- what each chore earns, with the rate written next to it;
- what got done this week, with a check per row;
- what the week totals, with the sum at the bottom;
- where the money goes, split into save, spend, and donate.
Keep the rates visible and the total prominent. The child should be able to point at the wall and read both "I earned $8 this week" and "this is what each chore was worth" without asking you to explain.
Step 1: Pick the earning model
Before you write a single rate, decide how allowance is earned. There are three common models, and they teach different lessons.
An earn-by-chore chart pays only for what gets done. Each chore has a rate, and the child earns the sum of the rows they finish. This teaches effort-tied income — the money shows up because work happened, not because the week passed.
A weekly fixed allowance is paid regardless of chores. The child gets a base amount every week, and bonus chores with their own rates sit on top. This teaches a steady floor plus the value of going further, and it sidesteps the debate of whether basic responsibilities like making the bed are "paid work" or just part of living in the house.
A save-spend-donate setup is less a separate model than a layer you add on top of either. Whatever the child earns flows into three jars, so a portion is always set aside for saving and giving rather than spending.
Many families blend the first two: a small weekly base paid regardless, plus paid chores on top. That combination keeps a predictable floor while still making extra money feel earned.
Step 2: Set rates and write them down
The numbers are where most allowance charts get fuzzy. The fix is to write a rate next to every chore and leave it there for a season. Moving the number around every week teaches the child that the rate is negotiable rather than earned.
A simple starting point is $1 to $2 per chore. Quick jobs — taking out the trash, feeding the pet, making the bed — sit at the low end. Longer or harder jobs — washing the car, mowing the lawn, cleaning the garage — pay more, because they take more time and effort. That spread is the lesson: harder work earns more, and the child can see it in the numbers.
A sample week might look like this:
| Chore | Earn |
|---|---|
| Take out trash | $1 |
| Wash dishes | $2 |
| Feed the pet | $0.50 |
| Tidy bedroom | $1 |
| Vacuum living room | $2 |
| Fold laundry | $1.50 |
| Week total | $8.00 |
The total at the bottom matters as much as the rows above it. Watching the number climb as checks go in is what makes the chart feel alive instead of like a static list.
Match the rates to the child's age. A six-year-old should have a handful of simple chores with small amounts; a teenager can carry bigger jobs and bigger numbers without the chart turning into a job board.
Step 3: Split the money three ways
Earning the money is only half the lesson. The other half is what happens to it, and that is where the save-spend-donate split earns its place.
A common split is 50% save, 40% spend, and 10% donate. The save jar gets the largest share, the spend jar covers the fun, and the donate jar keeps a small amount flowing out to someone else. Each jar should carry a stated purpose — "new bike fund," "snacks and games," "animal shelter" — because a labeled jar is a goal, not just a category.
The split does not have to be fixed forever. A child saving for something specific might shift to 70/20/10 for a while; a child with nothing to save for might tilt toward spend. The point is the habit: a portion of every dollar is set aside before any of it gets spent.
The three setups, side by side
The allowance chart template gives you all three setups on one canvas so you can pick, copy, or delete.
Earn-by-chore is the default and the most direct. Six chores, each with a rate and a done check, and a running total. It is the clearest expression of "work equals money," which is why it makes a good first chart.
Weekly fixed allowance pairs a base amount with paid bonus chores. The base is paid regardless — it is the child's floor. The bonuses are optional extras, each with its own rate, so the child can decide how much extra to go after.
Save, spend, donate splits whatever is earned into three labeled jars. It works on top of either model and is the part that turns an allowance from a payout into a small financial education.
You do not have to use all three. Pick the model that matches how your family pays, then tune the rates and jars to fit.
Common allowance chart mistakes
Chores with no rates
A chart that lists chores but no amounts never connects work to money. The child sees a to-do list, not a way to earn. Put a rate next to every chore so the link is visible.
Changing rates every week
If washing dishes is worth $2 one week and $1.50 the next, the child learns the number is negotiable. Set rates, write them down, and hold them steady for a season so "earned" keeps its meaning.
No total at the bottom
Rows alone hide the sum. Without a weekly total, the child never sees the money add up, which is the part that makes the effort feel real.
Paying without a split
Handing over the whole total teaches spending, not saving or giving. Route the money through save, spend, and donate so a portion is set aside by habit before anything gets spent.
Ignoring the child's age
A rate board built for a teenager will overwhelm a six-year-old, and a toddler's chart will bore a twelve-year-old. Match the number of chores and the dollar amounts to the age, and revisit them as the child grows.
How much allowance by age
There is no authoritative table for this, but a rough rule of thumb many parents use is a dollar per year of age per week — a seven-year-old gets about $7 a week, an eleven-year-old about $11. That base can be split across a fixed allowance, per-chore earnings, or a blend. What matters more than the exact figure is that the number stays consistent and the child understands how it is earned.
Younger children do better with a handful of small, frequent chores and amounts they can count. Older children can carry fewer but larger jobs — mowing, car washing, cleaning out the garage — where a single task earns several dollars and the saving goal becomes a real purchase. Revisit the rates on a birthday or at the start of a school year rather than changing them mid-season, so the chart holds steady long enough for the habit to form.
Keeping the chart useful over time
Review the chart every few months. As the child gets older, some chores become expected rather than paid, and new ones replace them. Move the bed-making and room-tidying off the paid list once they are routine, and swap in bigger jobs with bigger rates. Update the jars when goals change — the "new bike fund" jar becomes a "phone fund" jar when the goal is met.
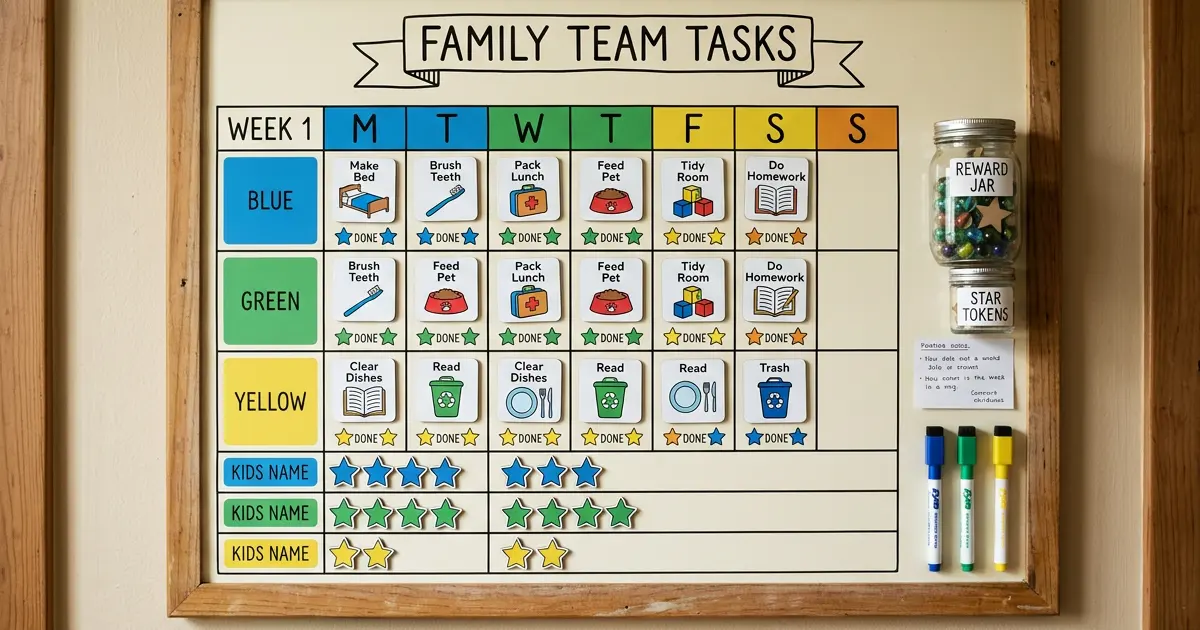
The chart should also stay somewhere visible. The value of a paper or whiteboard allowance chart over an app is that the numbers live on the wall where the whole family sees them, not behind a login. A quick glance on Sunday evening is enough to check off the week and read the total.
Start with the allowance chart template, replace the example chores and rates with your own, and split the total into three jars. For tracking who does what without the money, see the chore chart template.