Back to template

Value Stream Mapping Examples

These examples show how a value stream map changes by industry while keeping the same core: material or work flow, information flow, inventory, cycle time, and a lead-time ladder.

Value Stream Mapping Examples

Real examples

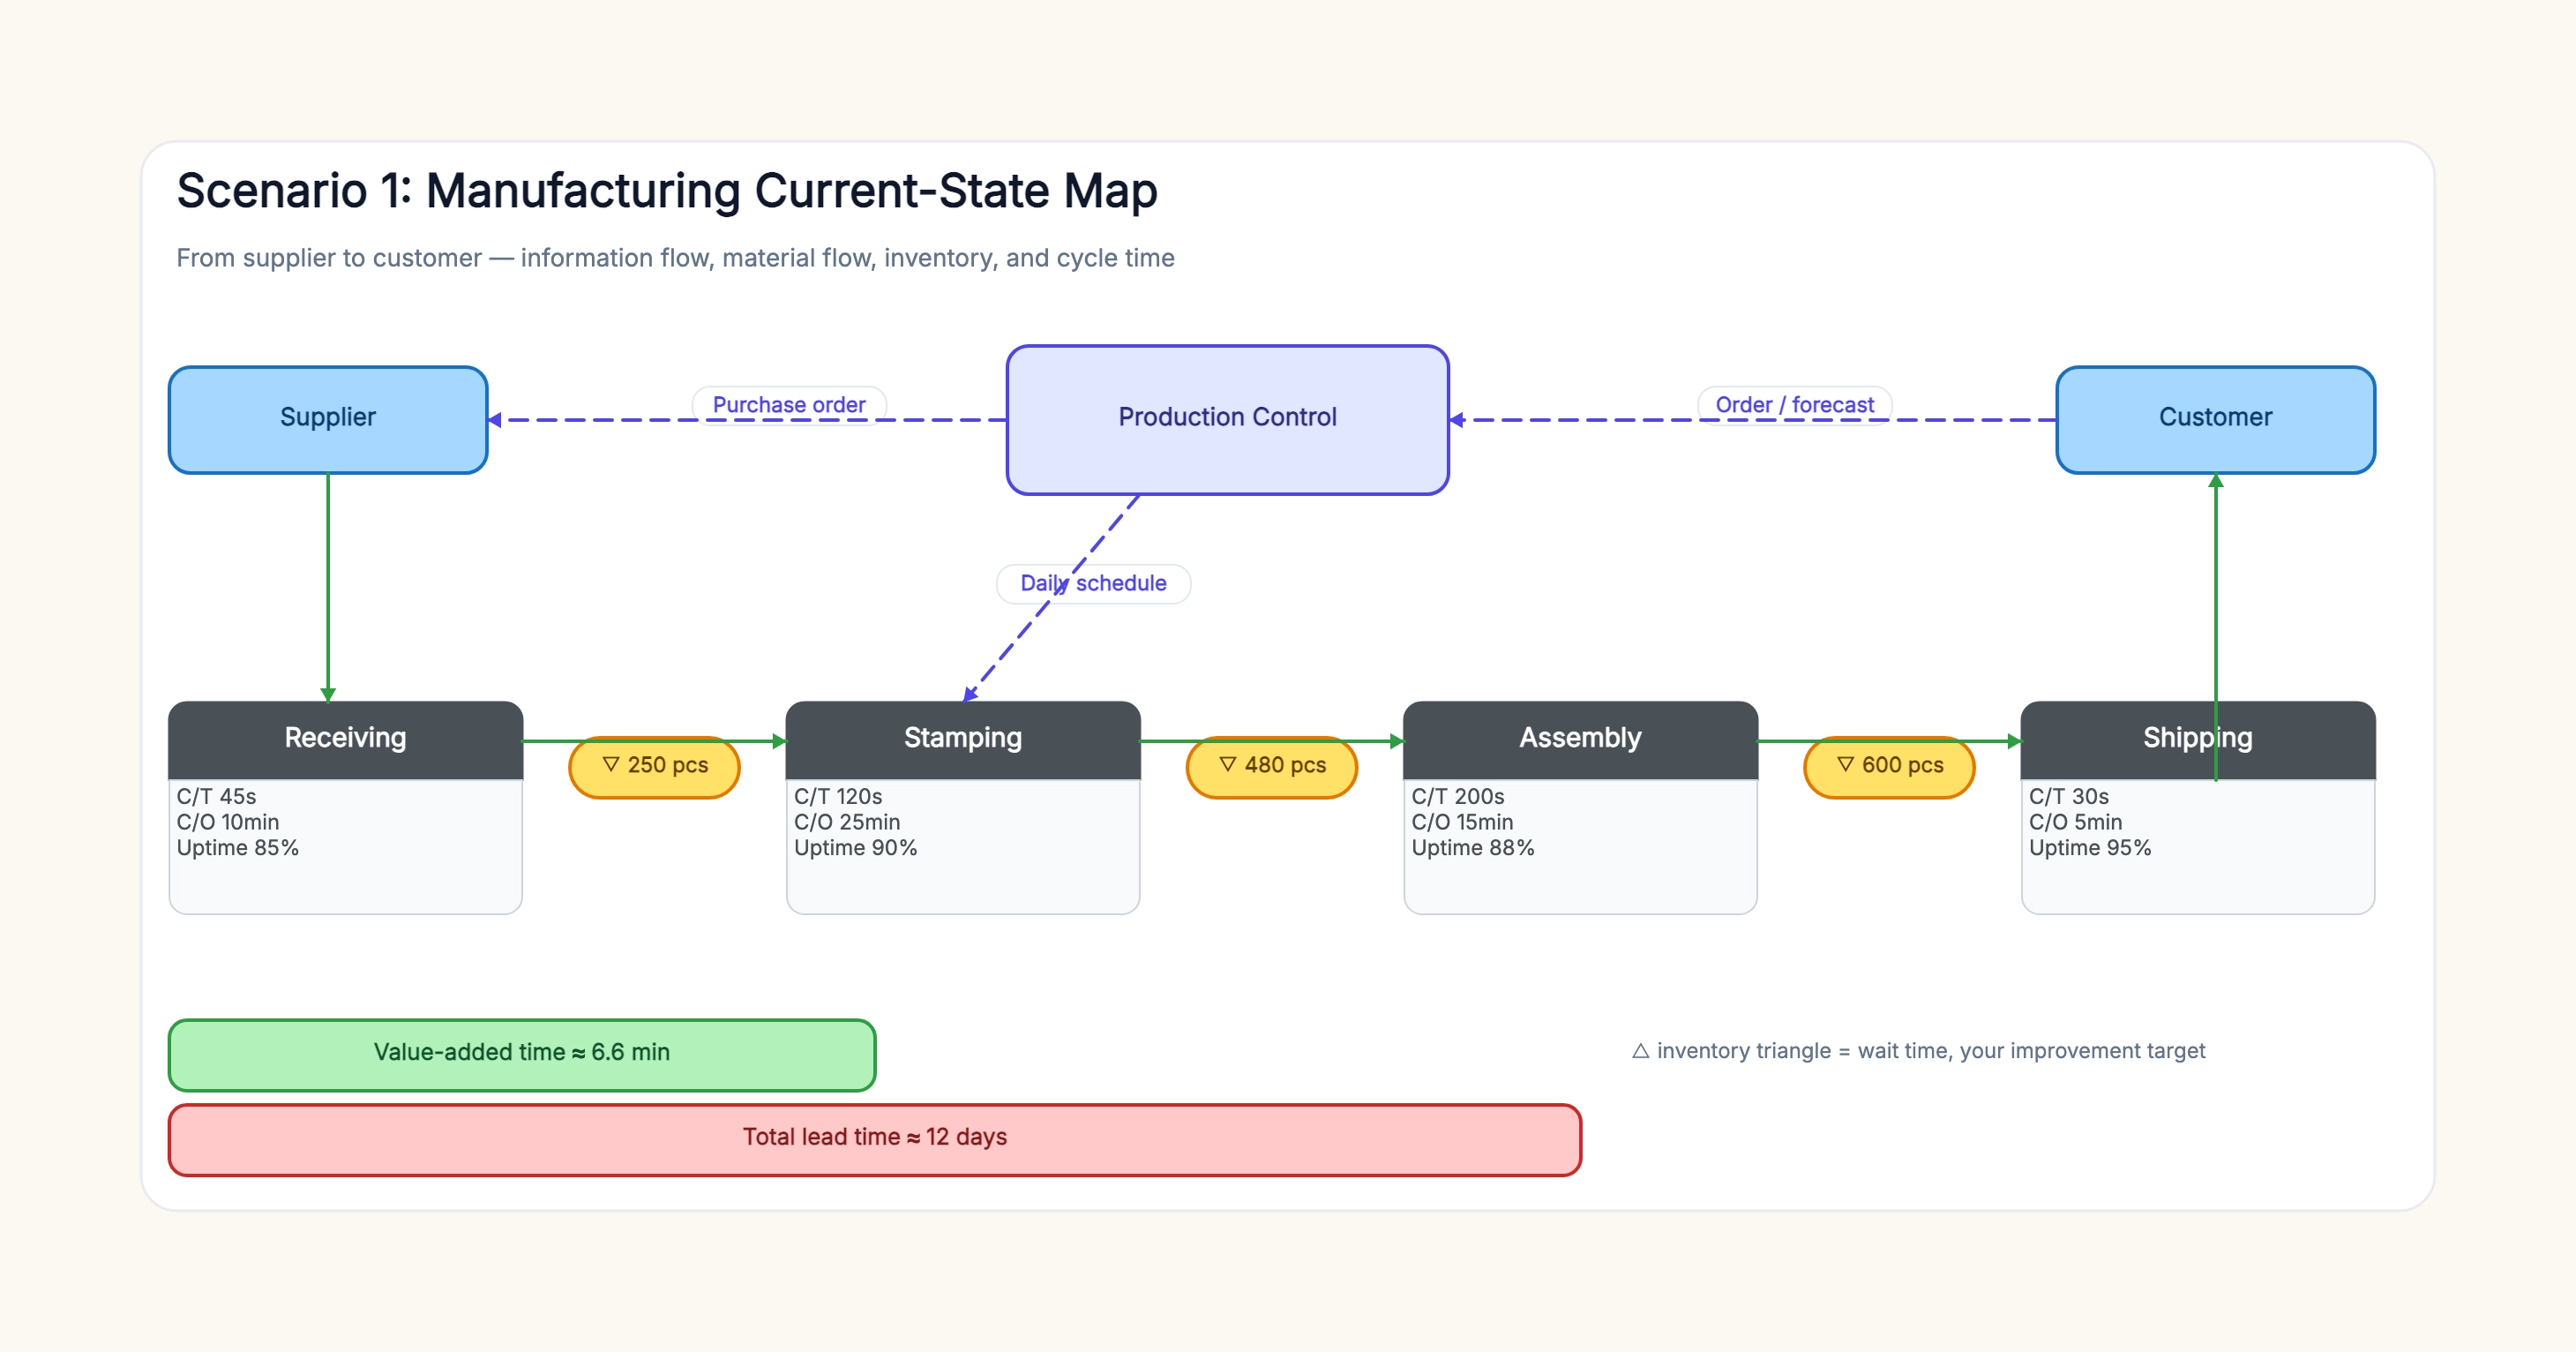
Manufacturing current-state map

Who uses it: A lean team mapping a production line

Supplier and customer at the ends
Production control sends orders and schedules
Receiving → stamping → assembly → shipping
Inventory triangles between processes
C/T, C/O, and uptime in each data box
Value-added time vs total lead time ladder

Why this works: Manufacturing maps emphasize information flow, inventory between processes, and the gap between value-added time and lead time.

Software delivery value stream

Who uses it: An engineering team improving delivery speed

Idea → backlog → develop → test → deploy → customer
Wait times labeled between stages
Backlog and pre-deploy marked as common wait points
Value-added vs total lead time compared

Why this works: Software streams often reveal that waiting in the backlog or before deployment dominates the lead time, not the actual coding.

E-commerce order fulfillment

Who uses it: An operations team reducing order lead time

Order → pick → pack → ship → deliver
Warehouse wait times labeled
In-transit time separated from warehouse work
Cycle time used to find the bottleneck

Why this works: E-commerce streams separate warehouse work from transit so teams can target the wait time they actually control.

Tips for better study mind maps

  • Always draw the information flow alongside the material flow.
  • Compare value-added time against total lead time, not just cycle time.
  • Use inventory triangles to mark every waiting point between processes.

Start editing online

Go back to the template, swap in your own topics, and keep the same structure if it fits your class or project.

Use this template: /editor/new?template=value-stream-map

Use the value stream mapping template