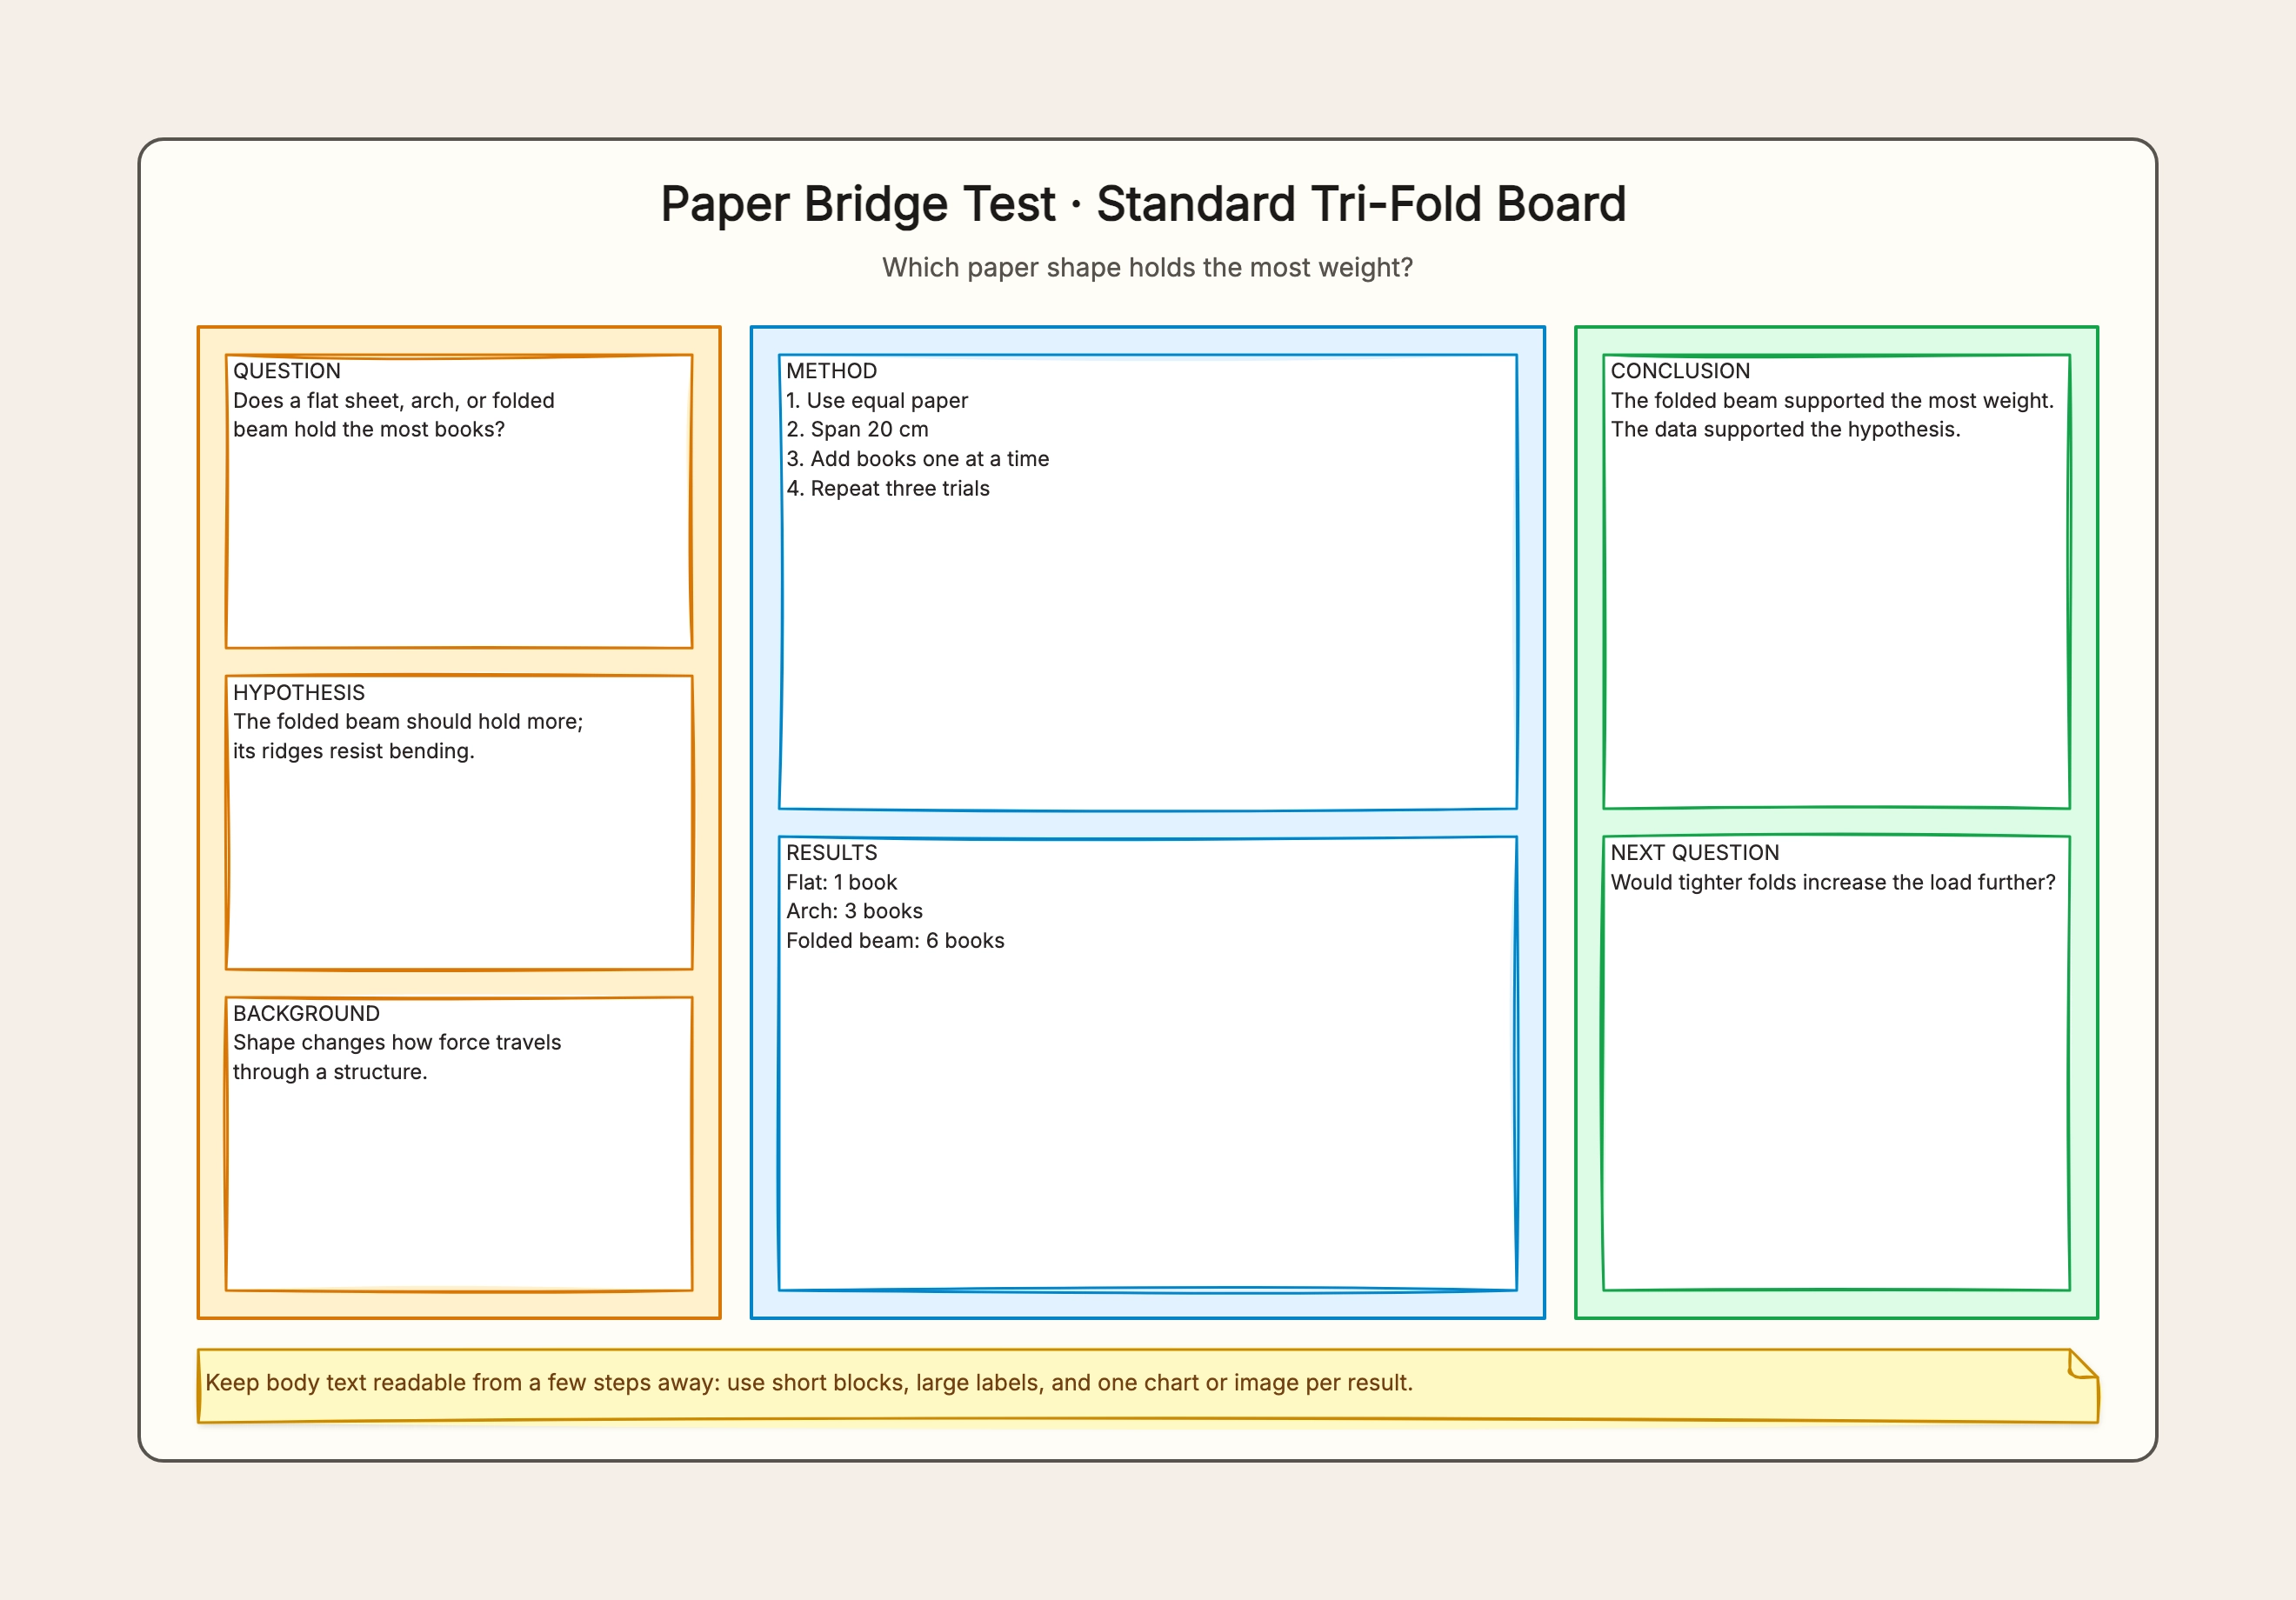
Paper bridge strength
Who uses it: A student running a controlled comparison
Question and hypothesis
Three paper shapes
Same span and paper
Repeated load results
Evidence-based conclusion
Why this works: A compact table makes the independent variable and measured outcome easy to compare.
Plant growth and light
Who uses it: An elementary science project
Prediction
4-, 8-, and 12-hour groups
14-day measurement
Growth chart and photos
What the student learned
Why this works: The board uses plain-language labels while preserving the controlled variables and numerical result.
Water filter redesign
Who uses it: An engineering design project
Problem and criteria
Design 1
Test evidence
Design 2
Claim about improvement
Why this works: The board compares iterations instead of forcing an engineering process into a hypothesis format.
Insulation material test
Who uses it: A student measuring temperature change
Equal containers
Four materials
Temperature every five minutes
Line chart
Sources of measurement error
Why this works: Time-series data belongs in a chart, with the measurement method next to it.
Local biodiversity survey
Who uses it: A field observation project
Survey question
Sites and sampling method
Species counts
Map and bar chart
Limits of the observation
Why this works: A small site map explains where counts came from without implying experimental causation.
Paper airplane design
Who uses it: A design-and-test project
Distance criterion
Three wing designs
Five throws each
Average and range
Chosen redesign
Why this works: Repeated trials and an average keep one lucky throw from becoming the whole conclusion.