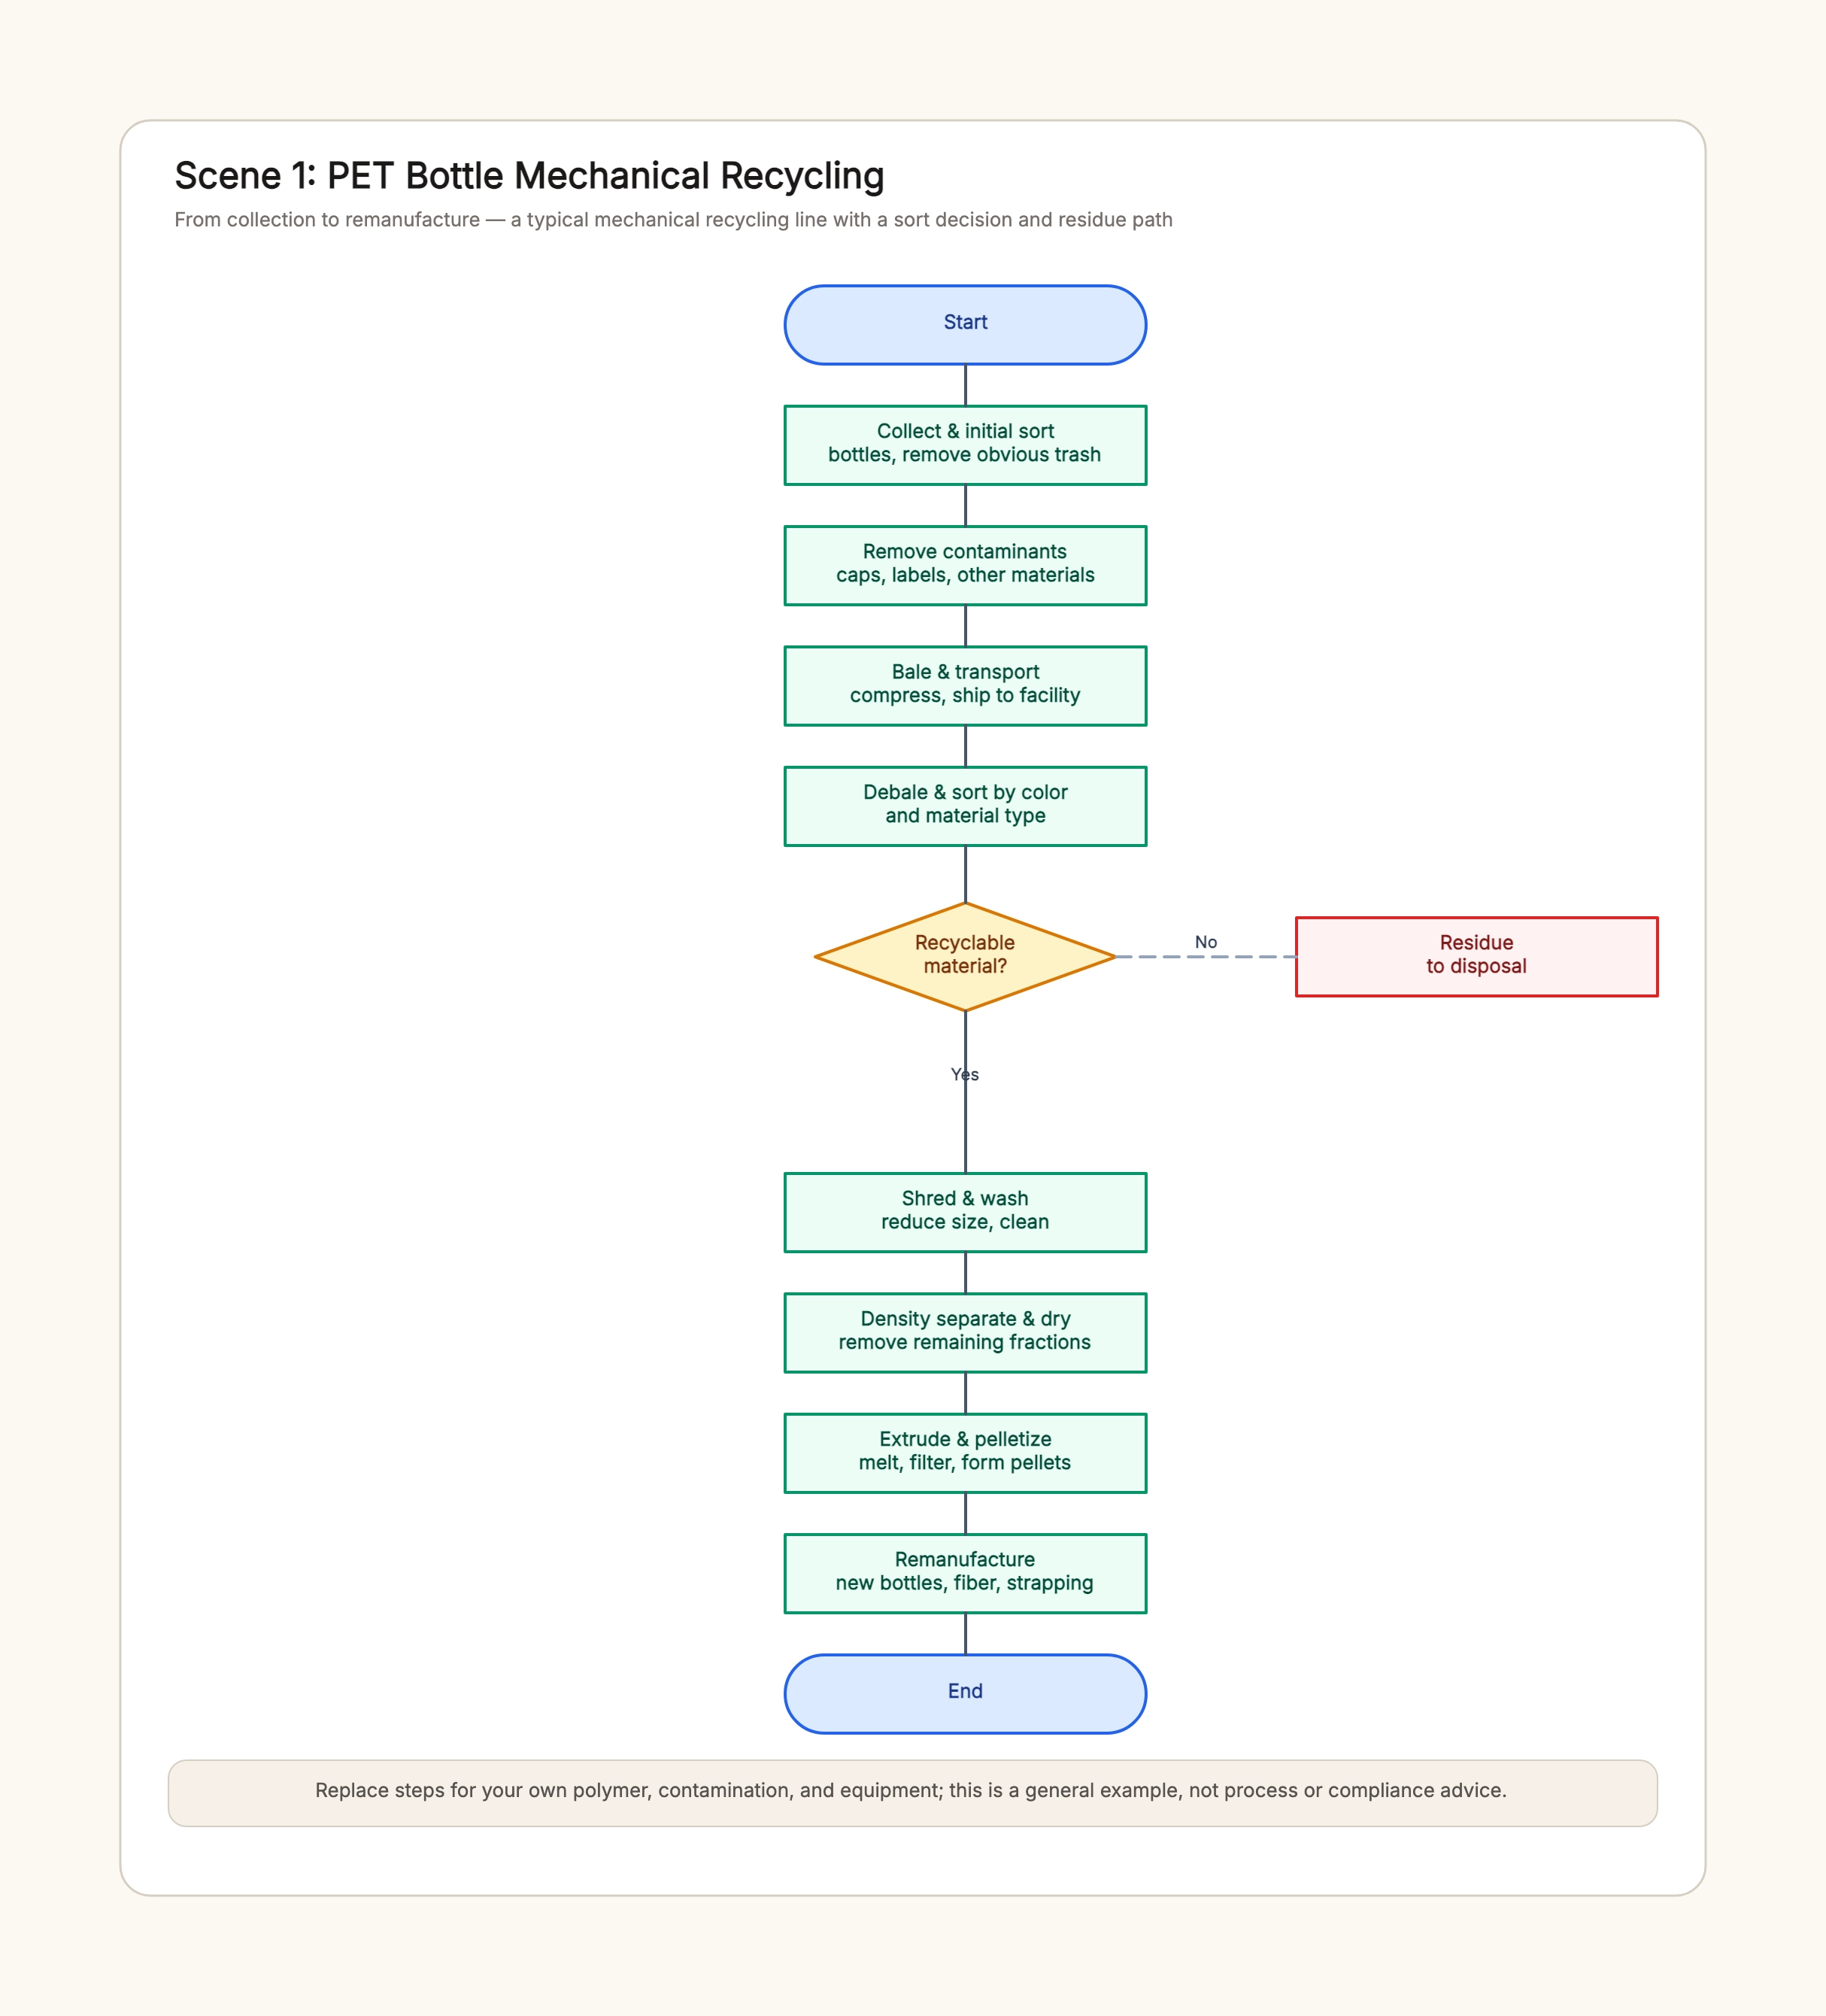
PET bottle recycling line
Who uses it: A recycler documenting a mechanical PET line
Collect & initial sort
→ Remove contaminants — caps, labels
→ Bale & transport
→ Debale & sort by color / material
→ Recyclable? Yes → Shred & wash
→ Density separate & dry → Extrude & pelletize
→ Remanufacture — bottles, fiber
No → Residue to disposal
Why this works: PET lines are relatively standardized, so the chart shows the classic sequence. The sort decision sits after debaling, where color and material separation happens, and the residue route is drawn as a dashed branch.
Rigid plastics recycling
Who uses it: A facility processing mixed rigid containers and crates
Collect rigid plastics — bottles, containers, crates
→ Sort by resin & color — PET, HDPE, PP, mixed
→ Shred to flakes
→ Wash & separate — hot wash, sink-float
→ Dry
→ Melt & filter
→ Pelletize & quality check
Why this works: Rigid plastic lines put sorting by resin and color first, because the mixed input needs separation before any processing. The wash and sink-float step is where remaining fractions are removed.
Mixed plastic at an MRF
Who uses it: A material recovery facility mapping its intake flow
Incoming load & weigh — record tonnage
→ Initial screening — remove oversized
→ Mechanical & manual sort — conveyors, pickers
→ Recyclable? Yes → Bale by type → Ship to recycler
No → Residue stream
Why this works: An MRF flow is about separation, not refinement, so it has fewer processing steps and more sorting and data recording. The tonnage recorded at intake and output is part of the process, not an afterthought.
Bottle-to-bottle closed loop
Who uses it: A brand explaining its recycled-content packaging loop
Collect used bottles
→ Sort & wash
→ Reprocess to food-grade pellets
→ Quality check — food-grade standard
→ Remanufacture new bottles
→ Back to market — closed loop
Why this works: A closed-loop chart emphasizes the return leg: used bottles become new bottles. The food-grade quality check is the critical decision point, because it gates whether the material can return to food packaging.
Recycling line with quality control
Who uses it: A plant adding QC gates to its process diagram
Sort & shred
→ Wash — contamination check?
→ Density separate — fractions check?
→ Dry & extrude
→ Pelletize — quality check?
Fail → Rework or residue
Why this works: Adding decision diamonds at the wash, separation, and pelletizing stages makes the quality controls explicit. Failed material routes to rework or residue instead of silently degrading the output.
Community collection scheme
Who uses it: A municipality explaining its plastic collection flow
Household collection
→ Drop-off points & pickups
→ Initial sort at depot
→ Ship to recycler — bales
Contaminated → Residue to disposal
Why this works: A community scheme keeps the flow simple because the sorting happens elsewhere. The contamination route is still drawn as a separate branch, so residents can see why dirty material is rejected.