早期创业公司架构图
使用场景: 创始人,首轮招聘前梳理创始团队
联合创始人 / CEO
|- 联合创始人 / CTO
| |- 工程师 × 2
|- 产品负责人
|- 增长负责人
这样组织的原因: 扁平化、宽汇报幅度的架构图向投资人传递出团队精干、每人覆盖多个职能的信号,这在种子轮阶段是加分项。
下面这些案例展示了不同规模和类型的团队怎样用组织架构图呈现管理结构:有创业公司的扁平化团队,有跨职能项目的矩阵组织,也有远程公司加时区标注的版本。找一个最接近你情况的直接改就行。
使用场景: 创始人,首轮招聘前梳理创始团队
这样组织的原因: 扁平化、宽汇报幅度的架构图向投资人传递出团队精干、每人覆盖多个职能的信号,这在种子轮阶段是加分项。
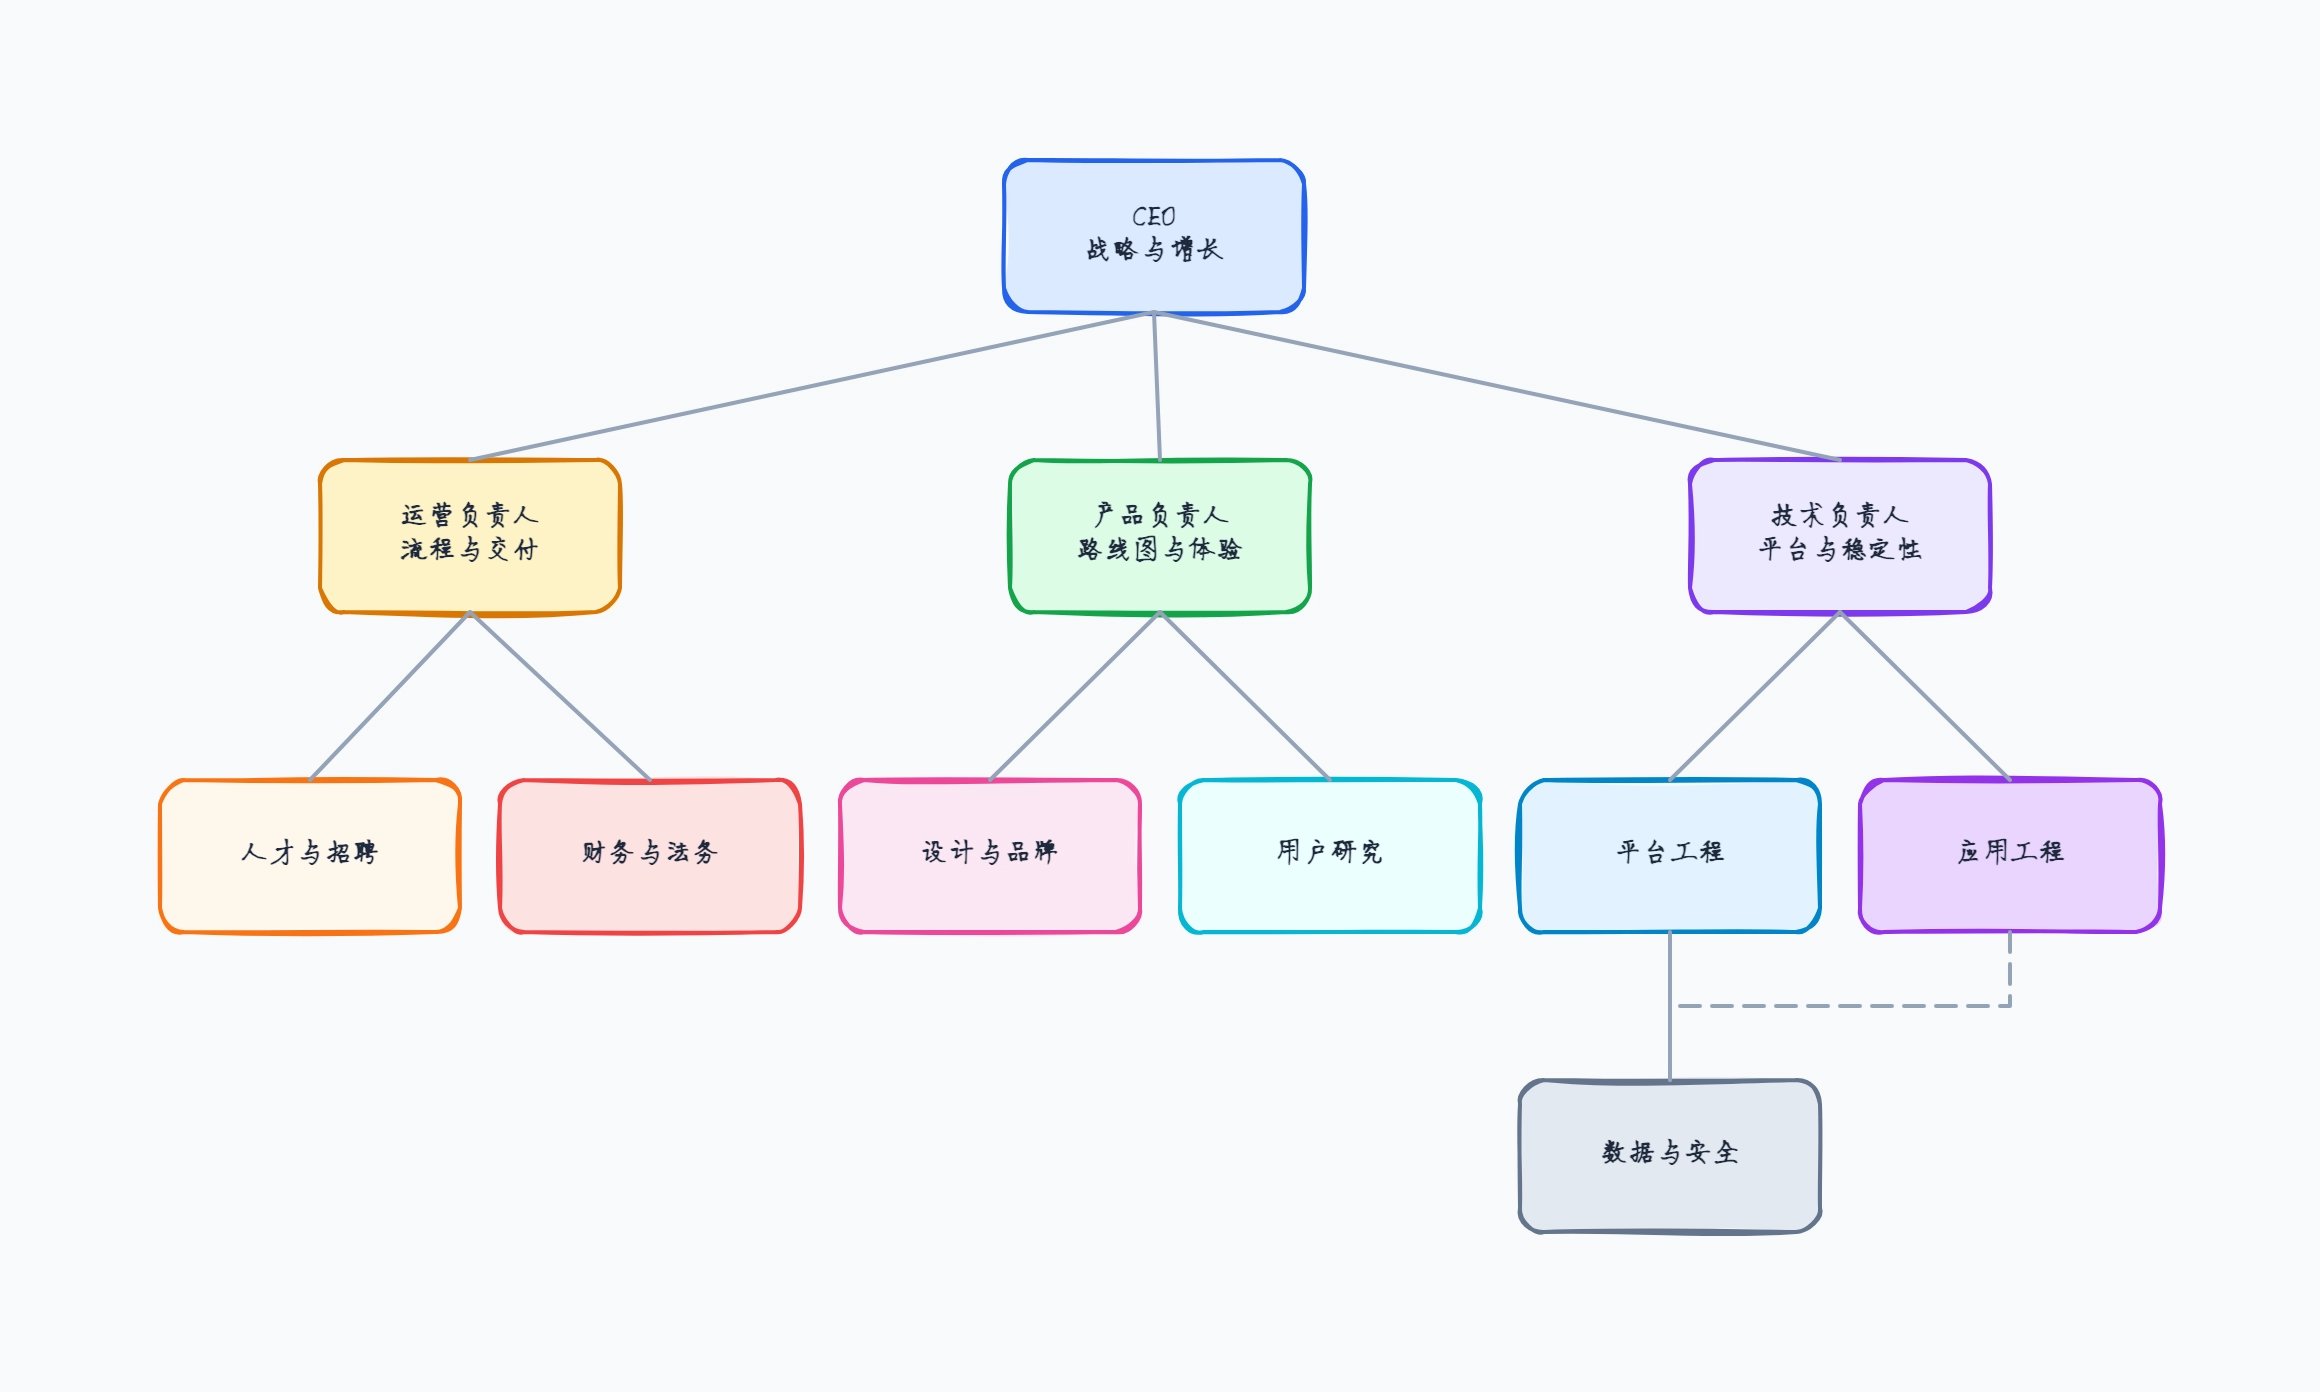
使用场景: 研发 VP,记录各技术方向负责人和其团队
这样组织的原因: 按技术方向而非产品功能分组,更容易看出研发资源分布在哪里,以及下一步该在哪个方向补充人手。
使用场景: 产品经理,在矩阵组织中表达虚线协作关系
这样组织的原因: 实线表示主线汇报,虚线表示项目归属,两种线型并存让职责边界清晰,避免出现"这个该谁负责"的模糊地带。
使用场景: 学生或行政人员,整理学院组织结构用于报告
这样组织的原因: 教育机构层级固定,自上而下的标准布局加统一方框尺寸,比自由排布读起来更快,也更符合正式报告的格式要求。
使用场景: HR 经理,管理分布在多个时区的远程团队
这样组织的原因: 在方框里加时区标注,安排跨国会议前不用再逐一查每个人的位置,节省了日常协作的沟通成本。
使用场景: 项目经理,向相关方说明项目决策结构
这样组织的原因: 治理架构图和运营组织图是两张不同的图:前者说明谁有权拍板这个项目,后者说明谁在日常向谁汇报,不要混在一张图里。
回到模板页,直接替换成你的课程主题、章节和复习重点,就可以继续使用这套结构。
使用这个模板: /editor/new?template=org-chart
使用这个模板