软件迭代计划
使用场景: 研发同学或 Scrum Master,规划两周 Sprint
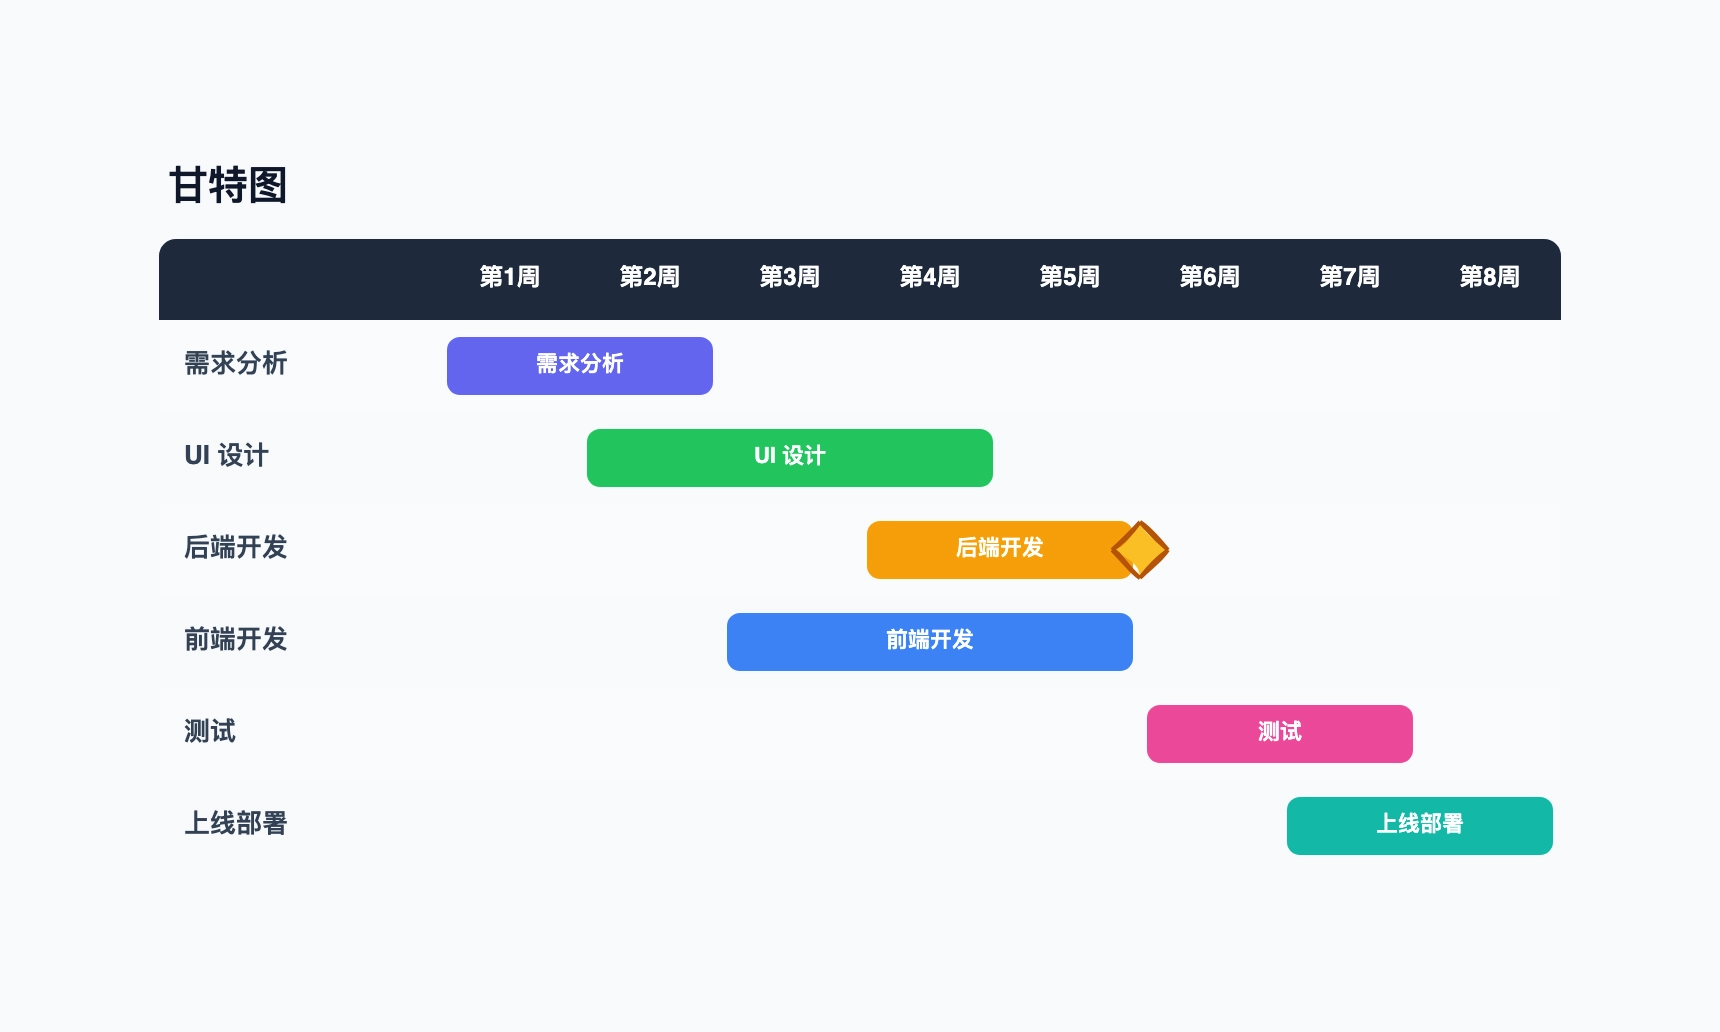
第 1 天: Sprint 计划会
第 1–8 天:功能开发(3 个任务并行)
第 6–9 天:代码审查
第 9–10 天:QA 测试
第 10 天: Sprint 演示(里程碑)
第 10 天: 回顾会议
这样组织的原因: 把并行的开发任务显示在同一横排,让人一眼看出哪两个工程师依赖同一个前置任务,需要提前协调。
使用场景: 研发同学或 Scrum Master,规划两周 Sprint
这样组织的原因: 把并行的开发任务显示在同一横排,让人一眼看出哪两个工程师依赖同一个前置任务,需要提前协调。
使用场景: 营销经理,协调内容、设计和付费投放多个团队
这样组织的原因: 内容和设计并行推进缩短了整体周期,但甘特图清楚地说明两者都必须在审批节点前完成,这才是真正的卡点。
使用场景: 数字代理商项目经理,管理客户项目
这样组织的原因: 每个阶段有清晰的交接点,客户和团队都知道什么时候需要反馈、什么时候进入下一阶段,不用等周会才能同步进度。
使用场景: 活动策划,协调供应商、场地和物流
这样组织的原因: 从活动日期倒推任务截止时间,让依赖关系一目了然——嘉宾确认延期,市场推广就跟着延期。
使用场景: 研究生或研究员,规划数月周期的研究
这样组织的原因: 长周期研究项目更需要甘特图,因为每个阶段都有最短持续时间——图上能直接看出跳过文献综述会把后续所有任务推后多少。
使用场景: 产品经理,向研发和管理层分享季度计划
这样组织的原因: 季度粒度的甘特图比 Sprint 计划粗,但给管理层提供了他们需要的全局视图,方便规划人员调配和对外公告时机。
回到模板页,直接替换成你的课程主题、章节和复习重点,就可以继续使用这套结构。
使用这个模板: /editor/new?template=gantt
使用这个模板