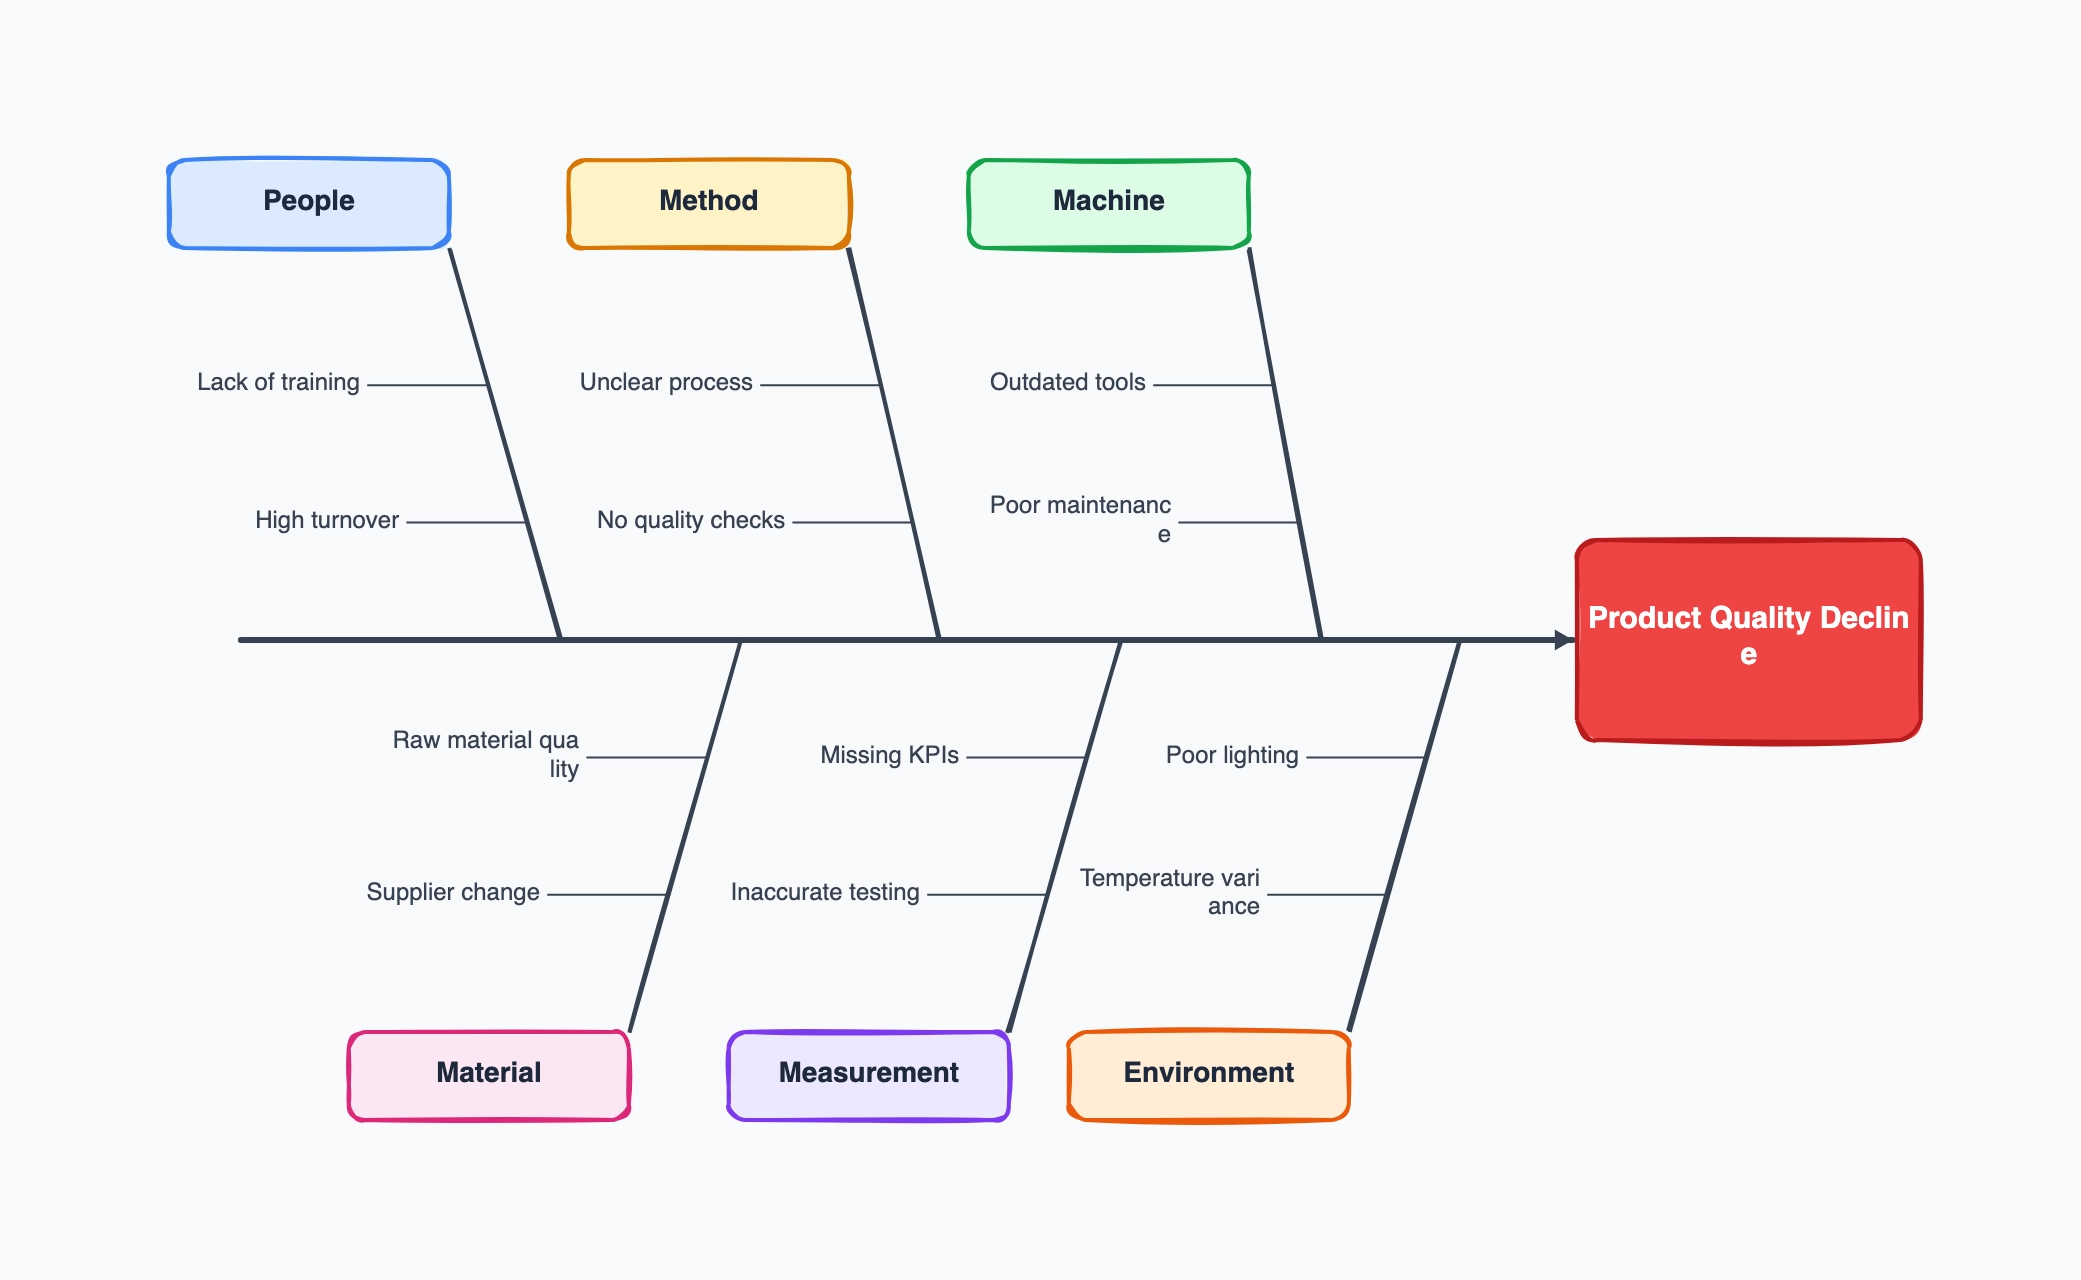
Manufacturing: high defect rate on an assembly line
Who uses it: Quality engineer or operations manager investigating production failures
People: Operators skipping steps | New hires not certified | Fatigue from overtime
Method: Outdated work instructions | No error-proofing (poka-yoke) at critical steps
Machine: Tooling wear not tracked | Calibration overdue on measuring instruments
Material: New supplier batch not re-qualified | Humidity damage to stored components
Measurement: CMM calibration expired | Sample size too small to catch low-frequency defects
Environment: Temperature swings causing thermal expansion | Vibration from adjacent equipment
Why this works: In manufacturing root cause analysis, the Machine and Method bones are often where the most actionable causes hide — operators follow the process they were trained on, even when the tools or instructions are the real failure point.
Software: repeated production incidents
Who uses it: Engineering manager or SRE running a post-mortem
People: On-call rotation gaps | Junior engineer made unsupervised production changes
Method: No pre-deploy checklist | Rollback procedure not documented or tested
Machine: Auto-scaling misconfigured | Dependency version pinning absent
Material: Third-party API breaking change | Stale config values in prod secrets
Measurement: Alert thresholds set too wide | No SLO breach alerting on the affected path
Environment: Production and staging diverged six weeks ago | No canary deployment
Why this works: Repeated incidents almost always point to the Method bone — the process failed, not just the individual who triggered the incident. Fishbone diagrams surface systemic issues that action items targeting individuals will never fix.
Healthcare: medication errors in a hospital ward
Who uses it: Nurse manager or patient safety officer reviewing an adverse event
People: Nurse interrupted during dispensing | Staff unfamiliar with new drug name similarity
Method: No double-check protocol for high-alert medications | Verbal orders not repeated back
Machine: Barcode scanner failure not escalated | Infusion pump alarm silenced
Material: Two drugs with near-identical packaging stored adjacently
Measurement: No real-time tracking of dispensing events | Audit gaps on controlled substances
Environment: Poor lighting in medication room | Noise level during shift handover
Why this works: Healthcare fishbone analyses often reveal that Material and Environment causes — like similar drug packaging or poor lighting — are high-impact but overlooked because they feel outside direct control. Naming them makes them addressable.
Service operations: high customer complaint volume
Who uses it: Customer success director or service quality lead
People: Support agents not trained on recent product update | High agent turnover
Method: No structured escalation path | First-response template not updated in eight months
Machine: CRM search returning outdated articles | Chat queue overflow not alerting supervisors
Material: Help center articles missing steps added in the last release
Measurement: CSAT survey sent too late — 72 hours after resolution instead of same day
Environment: Monday and Tuesday complaint spikes not staffed for
Why this works: In service operations the Method and Measurement bones drive the fastest improvements — a broken escalation path or a delayed CSAT survey are both process fixes that require no new tools or headcount.
Education: low student pass rate on a standardized exam
Who uses it: School administrator, curriculum lead, or teacher team
People: Teachers unfamiliar with updated exam format | High student absenteeism in final weeks
Method: Curriculum coverage stopped 3 weeks before exam topics | No practice test reviews
Machine: Classroom projectors malfunctioning | Online practice platform inaccessible from home
Material: Textbook edition does not cover two topics now on the exam
Measurement: Mock exams not graded and returned before the real test | No per-student gap tracking
Environment: Exam held in unfamiliar location | Noise from adjacent construction
Why this works: Education fishbone analyses often surface Method and Material mismatches — the curriculum and materials were designed for a previous exam version, not the one students actually sit. Naming this makes it a solvable procurement problem rather than a performance problem.
Project management: missed delivery deadline
Who uses it: Project manager or PMO lead in a retrospective
People: Key engineer left mid-project | Stakeholder reviews took twice the estimated time
Method: Scope change process not enforced | Dependencies between teams not mapped at kickoff
Machine: CI/CD pipeline broke for three days with no redundancy plan
Material: Design assets delivered two weeks late by external agency
Measurement: Velocity tracked but not compared to original estimate | No early warning triggers
Environment: Two public holidays not accounted for in the schedule
Why this works: Project deadline misses almost always have multiple contributing causes across bones — the fishbone forces teams to go beyond 'we underestimated' and name the specific people, process, and dependency failures that actually drove the slip.