Back to template

Data Pipeline Architecture Diagram Examples

These data pipeline examples show how different organizations structure their data stack depending on data volume, latency requirements, and team size. Each example maps a real platform scenario so you can identify which components match your own situation.

Data Pipeline Architecture Diagram Examples

Real examples

E-commerce analytics platform

Who uses it: Data engineer at a mid-size e-commerce company handling 1M+ orders/day

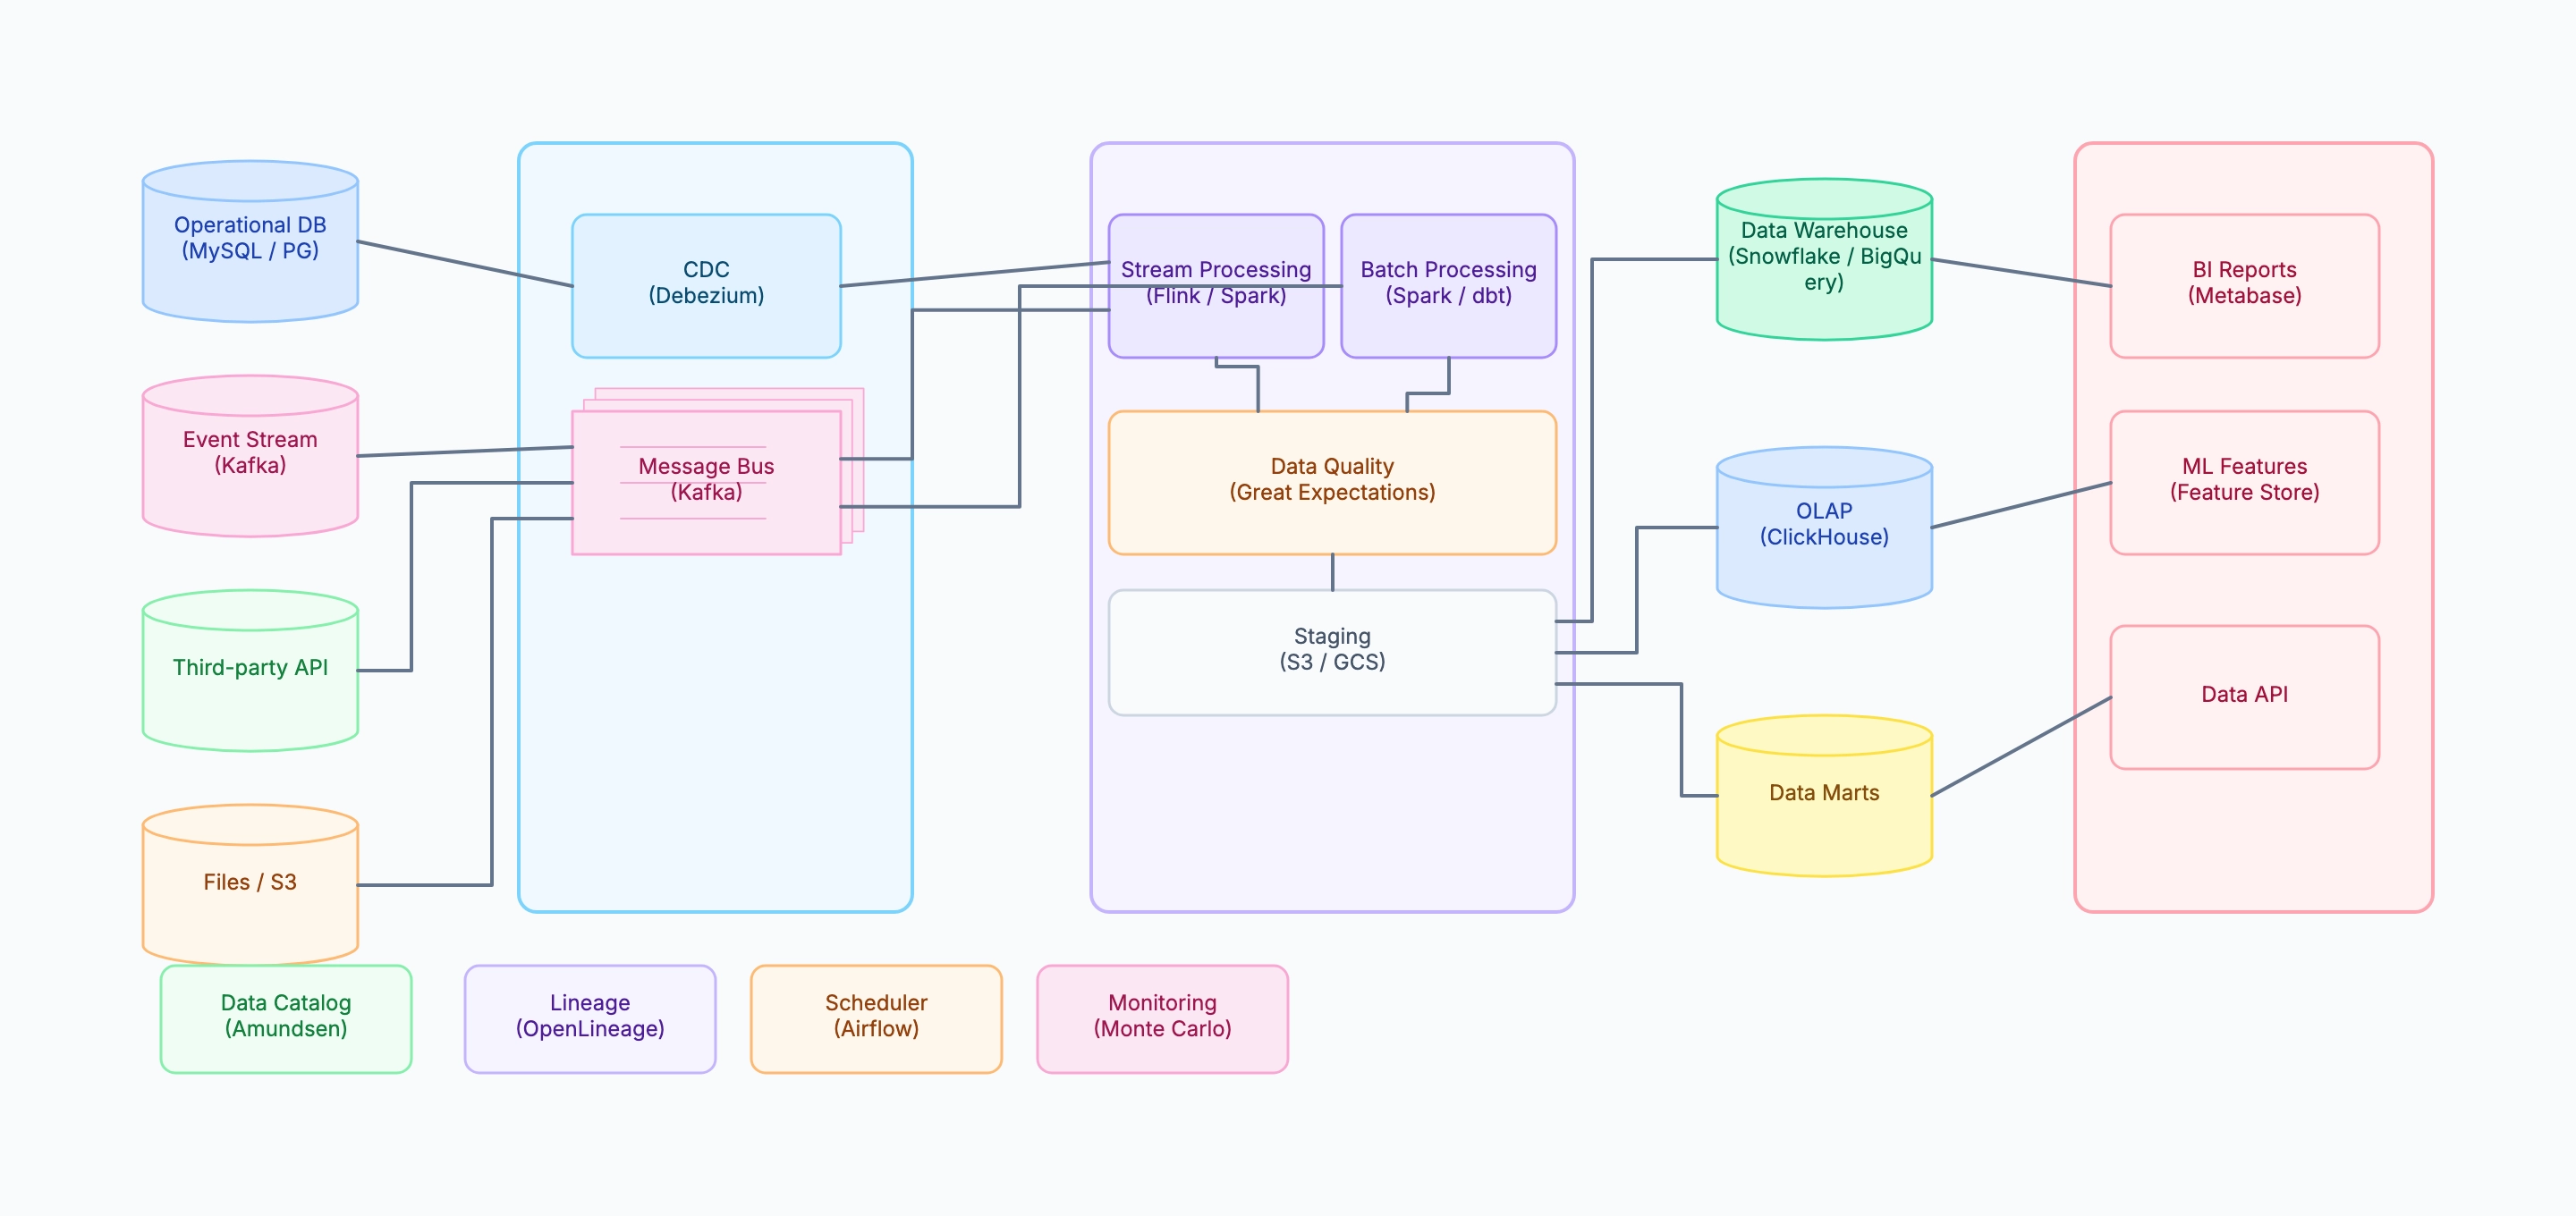
Sources: MySQL (orders, products), Kafka (clickstream events), Stripe webhook, S3 (application logs)
Ingestion: Debezium CDC → Kafka; Kafka consumer → S3 raw zone
Transform: Spark batch job runs every hour; dbt models transform raw → analytics
Quality: Great Expectations suite on row count, null rates, revenue totals
Warehouse: Snowflake with raw / staging / analytics / marts schema layers
Serving: Metabase dashboards, Feast ML features, internal data API
Governance: dbt docs as catalog, Monte Carlo for anomaly detection

Why this works: Separating raw, staging, and analytics schema layers in the warehouse means a broken transformation job only affects downstream consumers of that layer — the raw data remains intact and can be re-processed without re-ingestion.

Real-time fraud detection pipeline

Who uses it: Senior data engineer at a fintech company building a sub-second fraud scoring system

Sources: transaction events via Kafka (10K events/sec)
Stream processing: Flink with stateful aggregations (user velocity, merchant risk)
Feature store: Redis for real-time feature serving (< 5ms lookup)
ML inference: ONNX model serving via gRPC (< 20ms)
Decision sink: Kafka topic → transaction approval service
Batch path: daily retraining job using Spark + Snowflake historical data

Why this works: Showing both the real-time path and the batch retraining path in the same diagram helps reviewers understand that the model's quality depends on both the streaming feature freshness and the batch training data quality — two failure modes that require different monitoring strategies.

Startup data stack (small team, low cost)

Who uses it: Founding data engineer at a 30-person SaaS startup

Sources: PostgreSQL (application DB), Stripe API, HubSpot API
Ingestion: Fivetran connectors (managed, no custom code)
Transform: dbt Cloud — models run every 6 hours
Warehouse: BigQuery (pay-per-query, low fixed cost)
Serving: Looker Studio dashboards, CSV exports for sales team
No streaming, no feature store, no custom catalog — not needed yet

Why this works: A startup diagram intentionally shows what is absent — no CDC, no Kafka, no real-time — to communicate that the current stack is right-sized for the current data volume and team capacity, not a cost-cutting compromise.

Student data engineering project

Who uses it: Data engineering bootcamp student or computer science student

Source: public API (OpenWeather or GitHub Events)
Ingestion: Python script → Parquet files in local S3-compatible storage (MinIO)
Transform: Pandas or Spark local mode
Warehouse: DuckDB (embedded, no server required)
Serving: Jupyter notebook + matplotlib charts
Scheduler: simple cron job

Why this works: A student pipeline diagram that shows the same conceptual layers as production (source → ingest → transform → warehouse → serve) but with lightweight tools validates the student's understanding of the pattern, not just the technology.

Tips for better study mind maps

  • Show the batch and streaming paths as separate flows in the transformation layer — they often have different SLAs and failure modes.
  • Place data quality checks visually between the transform layer and the warehouse to signal that bad data is stopped before it reaches analysts.
  • Put governance components (catalog, lineage, scheduler, monitoring) in a separate row below the main flow — they are cross-cutting, not sequential.
  • Use cylinder shapes for storage systems (databases, warehouses, object stores) to distinguish them from processing nodes (rectangles).

Start editing online

Go back to the template, swap in your own topics, and keep the same structure if it fits your class or project.

Use this template: /editor/new?template=data-pipeline

Edit this data pipeline template