User authentication system
Who uses it: Backend engineer or security analyst documenting an auth flow
External: User → Login credentials
Process: Authenticate → validates against User DB
Data store: User DB → stores hashed passwords and tokens
Process: Generate session → writes to Session Store
Data store: Session Store → holds active sessions
Process: Return response → sends token or error to User
External: Audit Logger → receives login attempt record
Why this works: Mapping authentication as a DFD makes the audit logging step explicit — teams often implement login and forget to log failed attempts until a security review forces the issue.
E-commerce order processing
Who uses it: Systems analyst documenting an online store checkout flow
External: Customer → order details and payment info
Process: Validate order → checks inventory in Product DB
Data store: Product DB → inventory and pricing
Process: Process payment → sends to Payment Gateway
External: Payment Gateway → returns approval or decline
Process: Create order record → writes to Order DB
Data store: Order DB → stores confirmed orders
Process: Notify fulfillment → sends to Warehouse System
External: Warehouse System → triggers shipment
Why this works: The DFD reveals that payment and inventory checks are sequential — if inventory is checked after payment is taken, you risk charging customers for out-of-stock items. The diagram makes this race condition visible before it becomes a production bug.
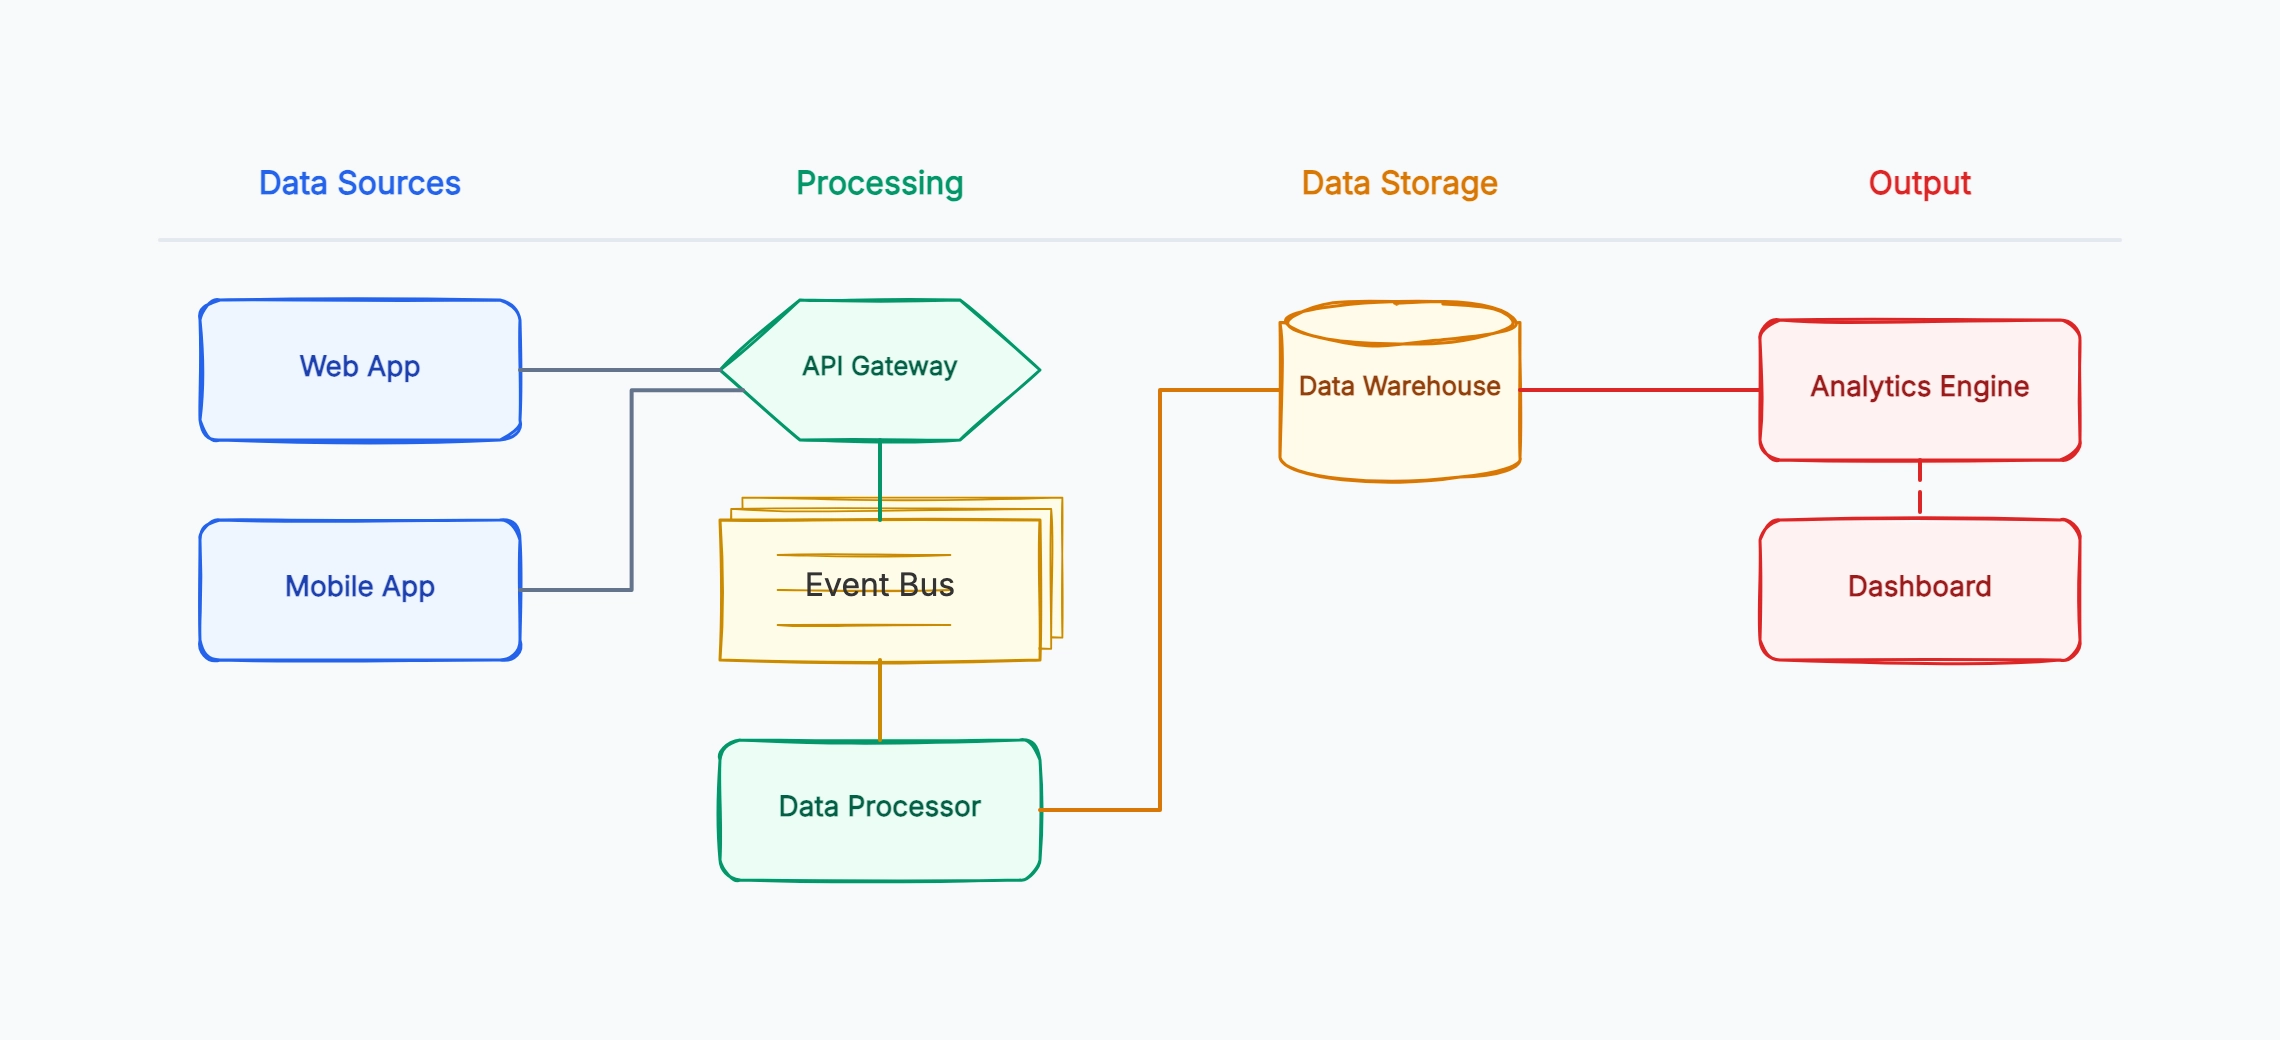
Analytics data pipeline
Who uses it: Data engineer documenting an event tracking pipeline
External: Web App → user events (clicks, views, purchases)
Process: Ingest events → validates and queues in Event Queue
Data store: Event Queue → raw event stream
Process: Transform events → cleans and enriches data
Data store: Data Warehouse → stores processed events
Process: Aggregate metrics → computes daily/weekly summaries
Data store: Metrics Store → holds aggregated results
External: Dashboard → reads from Metrics Store
Why this works: Showing the raw Event Queue and the processed Data Warehouse as separate stores makes it clear that re-running transformations is possible — teams that skip this distinction often cannot replay historical data when transformation logic changes.
API integration between two systems
Who uses it: Integration engineer or architect connecting two third-party systems
External: Source System → sends webhook on data change
Process: Receive webhook → validates signature and payload
Data store: Integration Log → records all incoming events
Process: Map fields → transforms source format to target format
Process: Call target API → sends transformed data
External: Target System → acknowledges or returns error
Process: Handle response → retries on failure, logs result
Why this works: The Integration Log data store is the key element most teams forget to add — without it, debugging a failed sync requires querying both systems and comparing records. The DFD makes logging a deliberate design decision, not an afterthought.
Content management and publishing
Who uses it: CTO or technical lead planning a CMS architecture
External: Author → submits draft content
Process: Review workflow → routes to editor or publisher
Data store: Draft Store → holds unpublished content
Process: Approve and publish → moves content to Published DB
Data store: Published DB → live content
Process: Deliver content → serves via CDN
External: Reader → receives published page
External: Search Indexer → reads from Published DB
Why this works: Including the Search Indexer as an external entity makes it explicit that publishing triggers an indexing side effect. Teams that do not model this often discover that content is served but not indexed, or indexed before it is published.
IoT sensor data collection
Who uses it: Embedded systems or platform engineer designing a sensor pipeline
External: Sensor devices → raw readings (temperature, pressure, etc.)
Process: Collect readings → validates and timestamps data
Data store: Raw Data Store → stores unprocessed sensor output
Process: Detect anomalies → compares against thresholds
Process: Aggregate readings → computes hourly averages
Data store: Processed Data Store → holds clean aggregated data
External: Alert System → notified on anomaly
External: Dashboard → visualizes processed data
Why this works: Separating anomaly detection from aggregation as two distinct processes means they can run independently — anomaly alerts fire in real time while aggregations run on a slower schedule, a design decision that is obvious in the DFD but easily missed in prose documentation.