Biology finals — cellular metabolism map
Who uses it: Sophomore biology student mapping 8 core concepts and 10+ relationships 2 days before finals
Focus question: 'How does the cell extract energy from glucose?'
Top center: Glucose → `enters` → Glycolysis → `produces` → Pyruvate + 2 ATP
Left branch: Pyruvate → `enters` → Mitochondria → `drives` → Krebs Cycle → `produces` → NADH / FADH2 / 2 ATP
Right branch: NADH → `feeds` → Electron Transport Chain → `produces` → 34 ATP ← `requires` ← Oxygen
Bottom: Anaerobic conditions → `alternative to` → Fermentation → `produces` → Lactate (animals) / Ethanol + CO2 (yeast)
Cross-link: Pyruvate accumulation ← `triggers` ← Exercise intensity > aerobic threshold
Why this works: Biology concepts naturally fit the hierarchical + cross-link structure. The key insight comes from the cross-link connecting cellular metabolism to exercise physiology. Without cross-links, students would see aerobic and anaerobic pathways as independent; the cross-link reveals their dynamic relationship. After drawing, count your cross-links — fewer than 2 means you've drawn a classification tree, not a concept map. In CodePic, use ellipses for concepts and labeled connectors for relationship words (`produces` / `requires` / `triggers`).
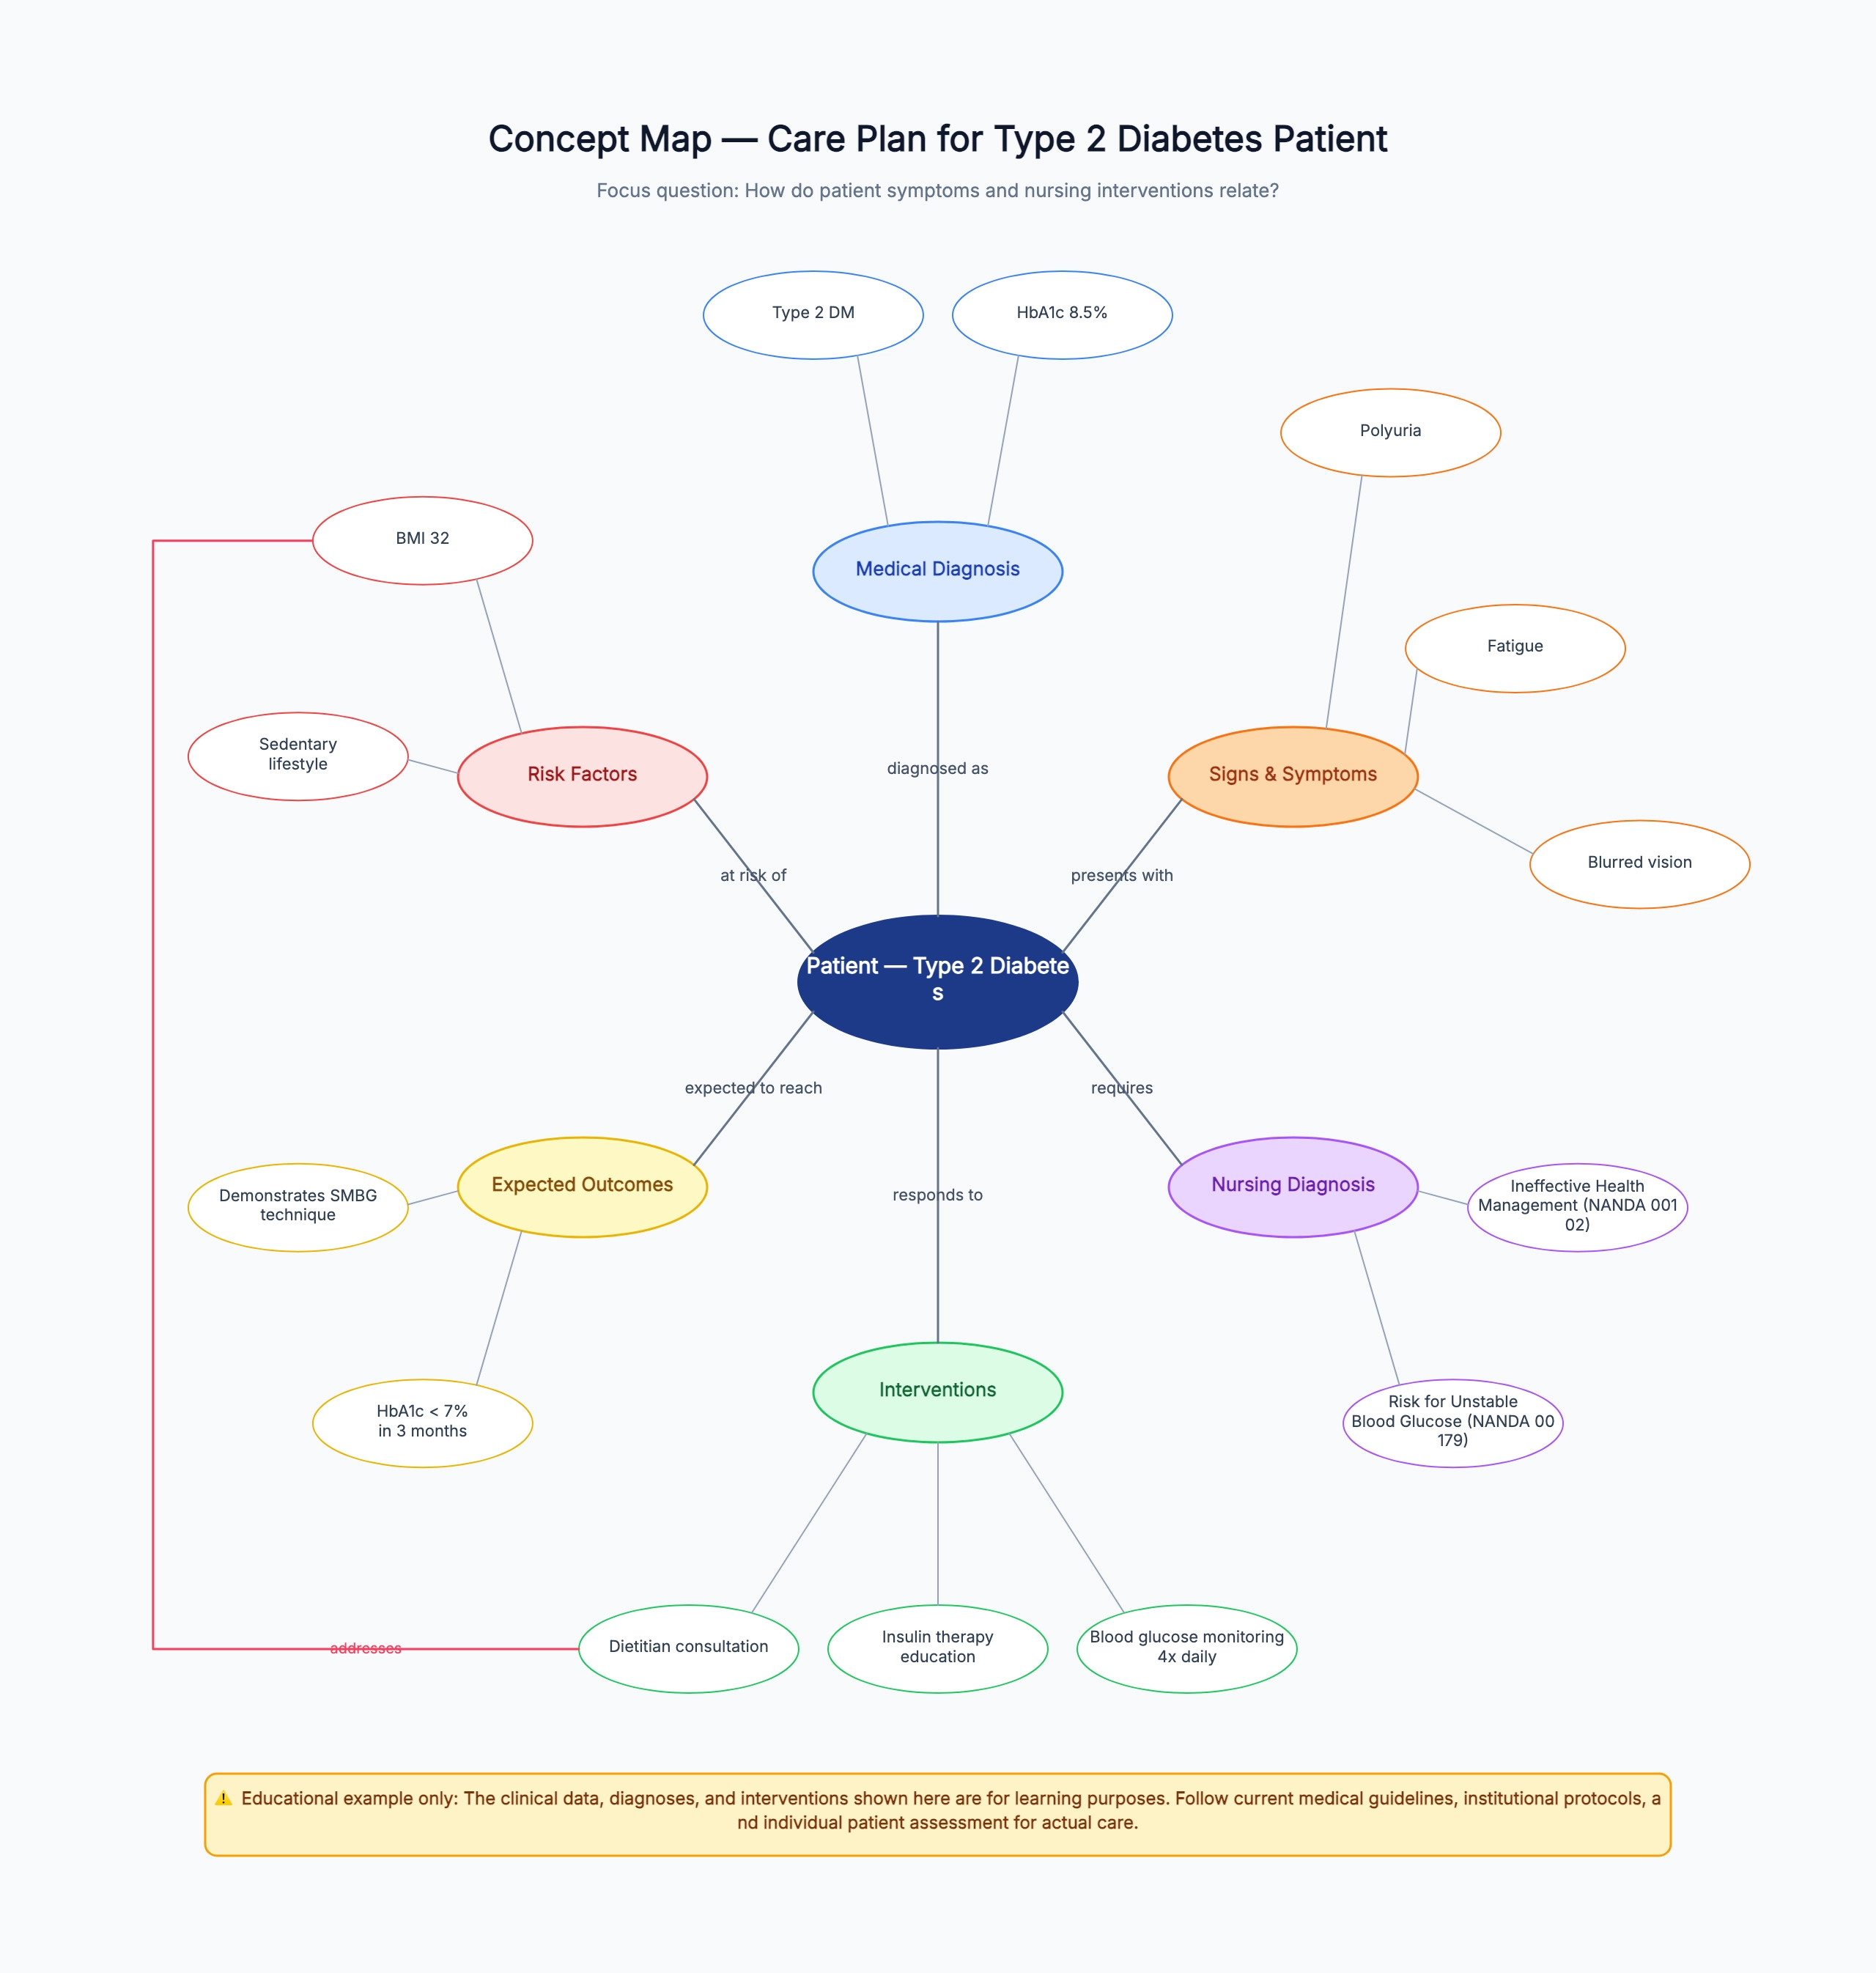
Nursing student — Type 2 Diabetes care plan
Who uses it: Nursing sophomore completing an ADPIE assignment with 6 classification nodes and 2–3 items each
Focus question: 'How do nursing interventions stabilize blood glucose for a hospitalized Type 2 Diabetes patient?'
Central: Patient — Type 2 Diabetes
Medical Dx: Type 2 Diabetes Mellitus / HbA1c 8.5% / BMI 32
Signs & Symptoms: Polyuria / Fatigue / Blurred vision
Nursing Dx: Ineffective Health Management (NANDA 00102) / Risk for Unstable Blood Glucose (NANDA 00179)
Interventions: Blood glucose monitoring 4x daily / Insulin therapy education / Dietitian consultation
Expected Outcomes: HbA1c < 7% in 3 months / Patient demonstrates SMBG technique / No hypoglycemic episodes
Cross-link: Fatigue ← `increases risk of` → Fall risk (Symptoms ↔ Risk Factors safety cross-link)
Why this works: Nursing concept maps force students to link every Nursing Diagnosis to its corresponding Interventions and Expected Outcomes. Always check: each Nursing Diagnosis must have ≥1 Intervention + ≥1 Expected Outcome connected on the map — missing one costs grading points. The cross-link from Fatigue (Symptoms) to Fall Risk (Risk Factors) demonstrates holistic thinking — a symptom that seems clinical also has direct safety implications. Educational example only — always follow current medical guidelines and individual patient assessment for actual clinical care.
Nursing student — pediatric asthma post-shift debrief
Who uses it: Pediatric nursing intern reflecting on a 2-hour asthma exacerbation shift using concept mapping
Focus question: 'In this pediatric asthma exacerbation, what was the assessment–intervention–outcome causal chain?'
Central: Child — Acute Asthma Exacerbation (age 6, 2-hour incident review)
Assessment (recorded at the time): Respiratory rate 40/min / SpO2 89% / Expiratory wheezing / Accessory muscle use
Nursing Dx: Ineffective Breathing Pattern (NANDA 00032) / Anxiety (child + parent) (NANDA 00146)
Interventions (as performed): Albuterol nebulization Q20min × 3 / Semi-Fowler's position / Parent reassurance
Expected Outcomes (compared with actual): SpO2 ≥ 95% within 1 hour / Respiratory rate < 30/min within 2 hours / Decreased wheezing
Cross-link (surfaced during debrief): Parent anxiety ← `increases` → Child heart rate ← `worsens` → Oxygen demand
Why this works: No one draws a concept map during an active emergency — but a 30-minute post-shift debrief on a concept map lets an intern connect scattered assessment / intervention / outcome data into a causal chain. Cross-links often only surface during debrief — 'parent anxiety → child heart rate → oxygen demand' was invisible in the moment but obvious on the map, revealing that 'next time, address parental emotion in parallel with medical intervention.' In CodePic, use different ellipse colors for Assessment (blue), Diagnosis (yellow), and Intervention (green) — you'll see at a glance where your observation was thorough vs where action outpaced observation.
Product manager — B2B SaaS entering SMB market
Who uses it: PM mapping 1 core hypothesis + 3 external factors + 4 internal resources + 2 assumptions after competitive analysis
Focus question: 'What conditions must our product meet to validate PMF in the SMB segment?'
Core proposition: B2B SaaS enters SMB market
Enables ← 200+ existing API integrations / Implementation cycle < 7 days / Customer NPS 68
Threatens ← Competitor just dropped prices 30% / SMB average ACV is 1/5 of enterprise
Assumes → Verify: 15 SMB customer interviews by July 30
Assumes → Verify: 10 early-adopter program signups by Aug 15
Cross-link: Fast implementation < 7 days ← `may offset` ← Competitor 30% price drop
Why this works: Business concept maps differ from academic/nursing ones — every `assumes` node must have a verifiable deadline + action attached. Without verification, it's an opinion map, not a strategy tool. The most valuable insight came from the cross-link: connecting fast implementation with competitor price drop revealed a potential strategic hedge — if SMB customers value speed over price, the 30% gap may not be fatal. After drawing, add a verification note below each `assumes` node using CodePic's text element, then export as image for team discussion.
Book synthesis — 3 books on learning theory
Who uses it: A reader connecting core arguments from 3 cognitive science books to find where they support and contradict each other
Focus question: 'How do different learning theory schools explain the effectiveness of chunked instruction?'
Central: Chunked Instruction — discussed by all 3 books from different angles
*Why Don't Students Like School* (Willingham, 2009): Working memory is limited → Chunking reduces cognitive load
*Make It Stick* (Brown et al., 2014): Retrieval practice + Spaced repetition → Chunking aids encoding
*Frames of Mind* (Gardner, 1983): Multiple intelligences → Single chunking strategy insufficient; multiple modes needed
Cross-link: Willingham × cognitive load ← `supports` ← Brown × spaced repetition — mechanisms may be complementary
Cross-link: Brown × encoding → `contradicts` ← Gardner × multiple intelligences — if different intelligences need different encoding, single chunking doesn't hold
Why this works: The unique value of personal knowledge concept maps is cross-book cross-links. Single-book notes would never surface the tension between Willingham ('chunking works because of limited working memory') and Gardner ('chunking is too narrow because learners need different presentation modes'). This contradiction is itself the most valuable insight — worth writing a blog post or note card about. In CodePic, use different connector colors for supporting vs contradictory cross-links (blue for support, red for contradiction) — visual coding makes cross-book tension immediately visible.
Literature review — 15 papers on remote work productivity
Who uses it: Graduate student clustering 15 papers into 4 thematic groups for a systematic literature review
Focus question: 'What are the key factors affecting remote work productivity, and how do they interact?'
Cluster 1 — Communication: Async tools / Sync meeting load / Information overload
Cluster 2 — Autonomy: Schedule flexibility / Self-management / Blurred boundaries → Burnout
Cluster 3 — Social capital: Lack of informal interaction / Team identification / Isolation
Cluster 4 — Tech environment: Bandwidth / Home office setup / VPN latency
Cross-link: Blurred boundaries → `leads to` → Burnout ← `may buffer` ← Informal interaction (if Slack social channels exist)
Cross-link: Information overload ← `worsens` ← Sync meetings > 3 hours/day
Why this works: Literature review concept maps shine at revealing causal relationships across research clusters. The communication cluster and social capital cluster look fine individually, but the cross-link reveals that 'lack of informal interaction → burnout' can happen even when autonomy is high, if there are no social Slack channels. This map serves as the visual framework for the literature review section of a thesis. In CodePic, add citation tags (author + year) to each node using small text labels — this keeps the map scholarly while remaining readable.